
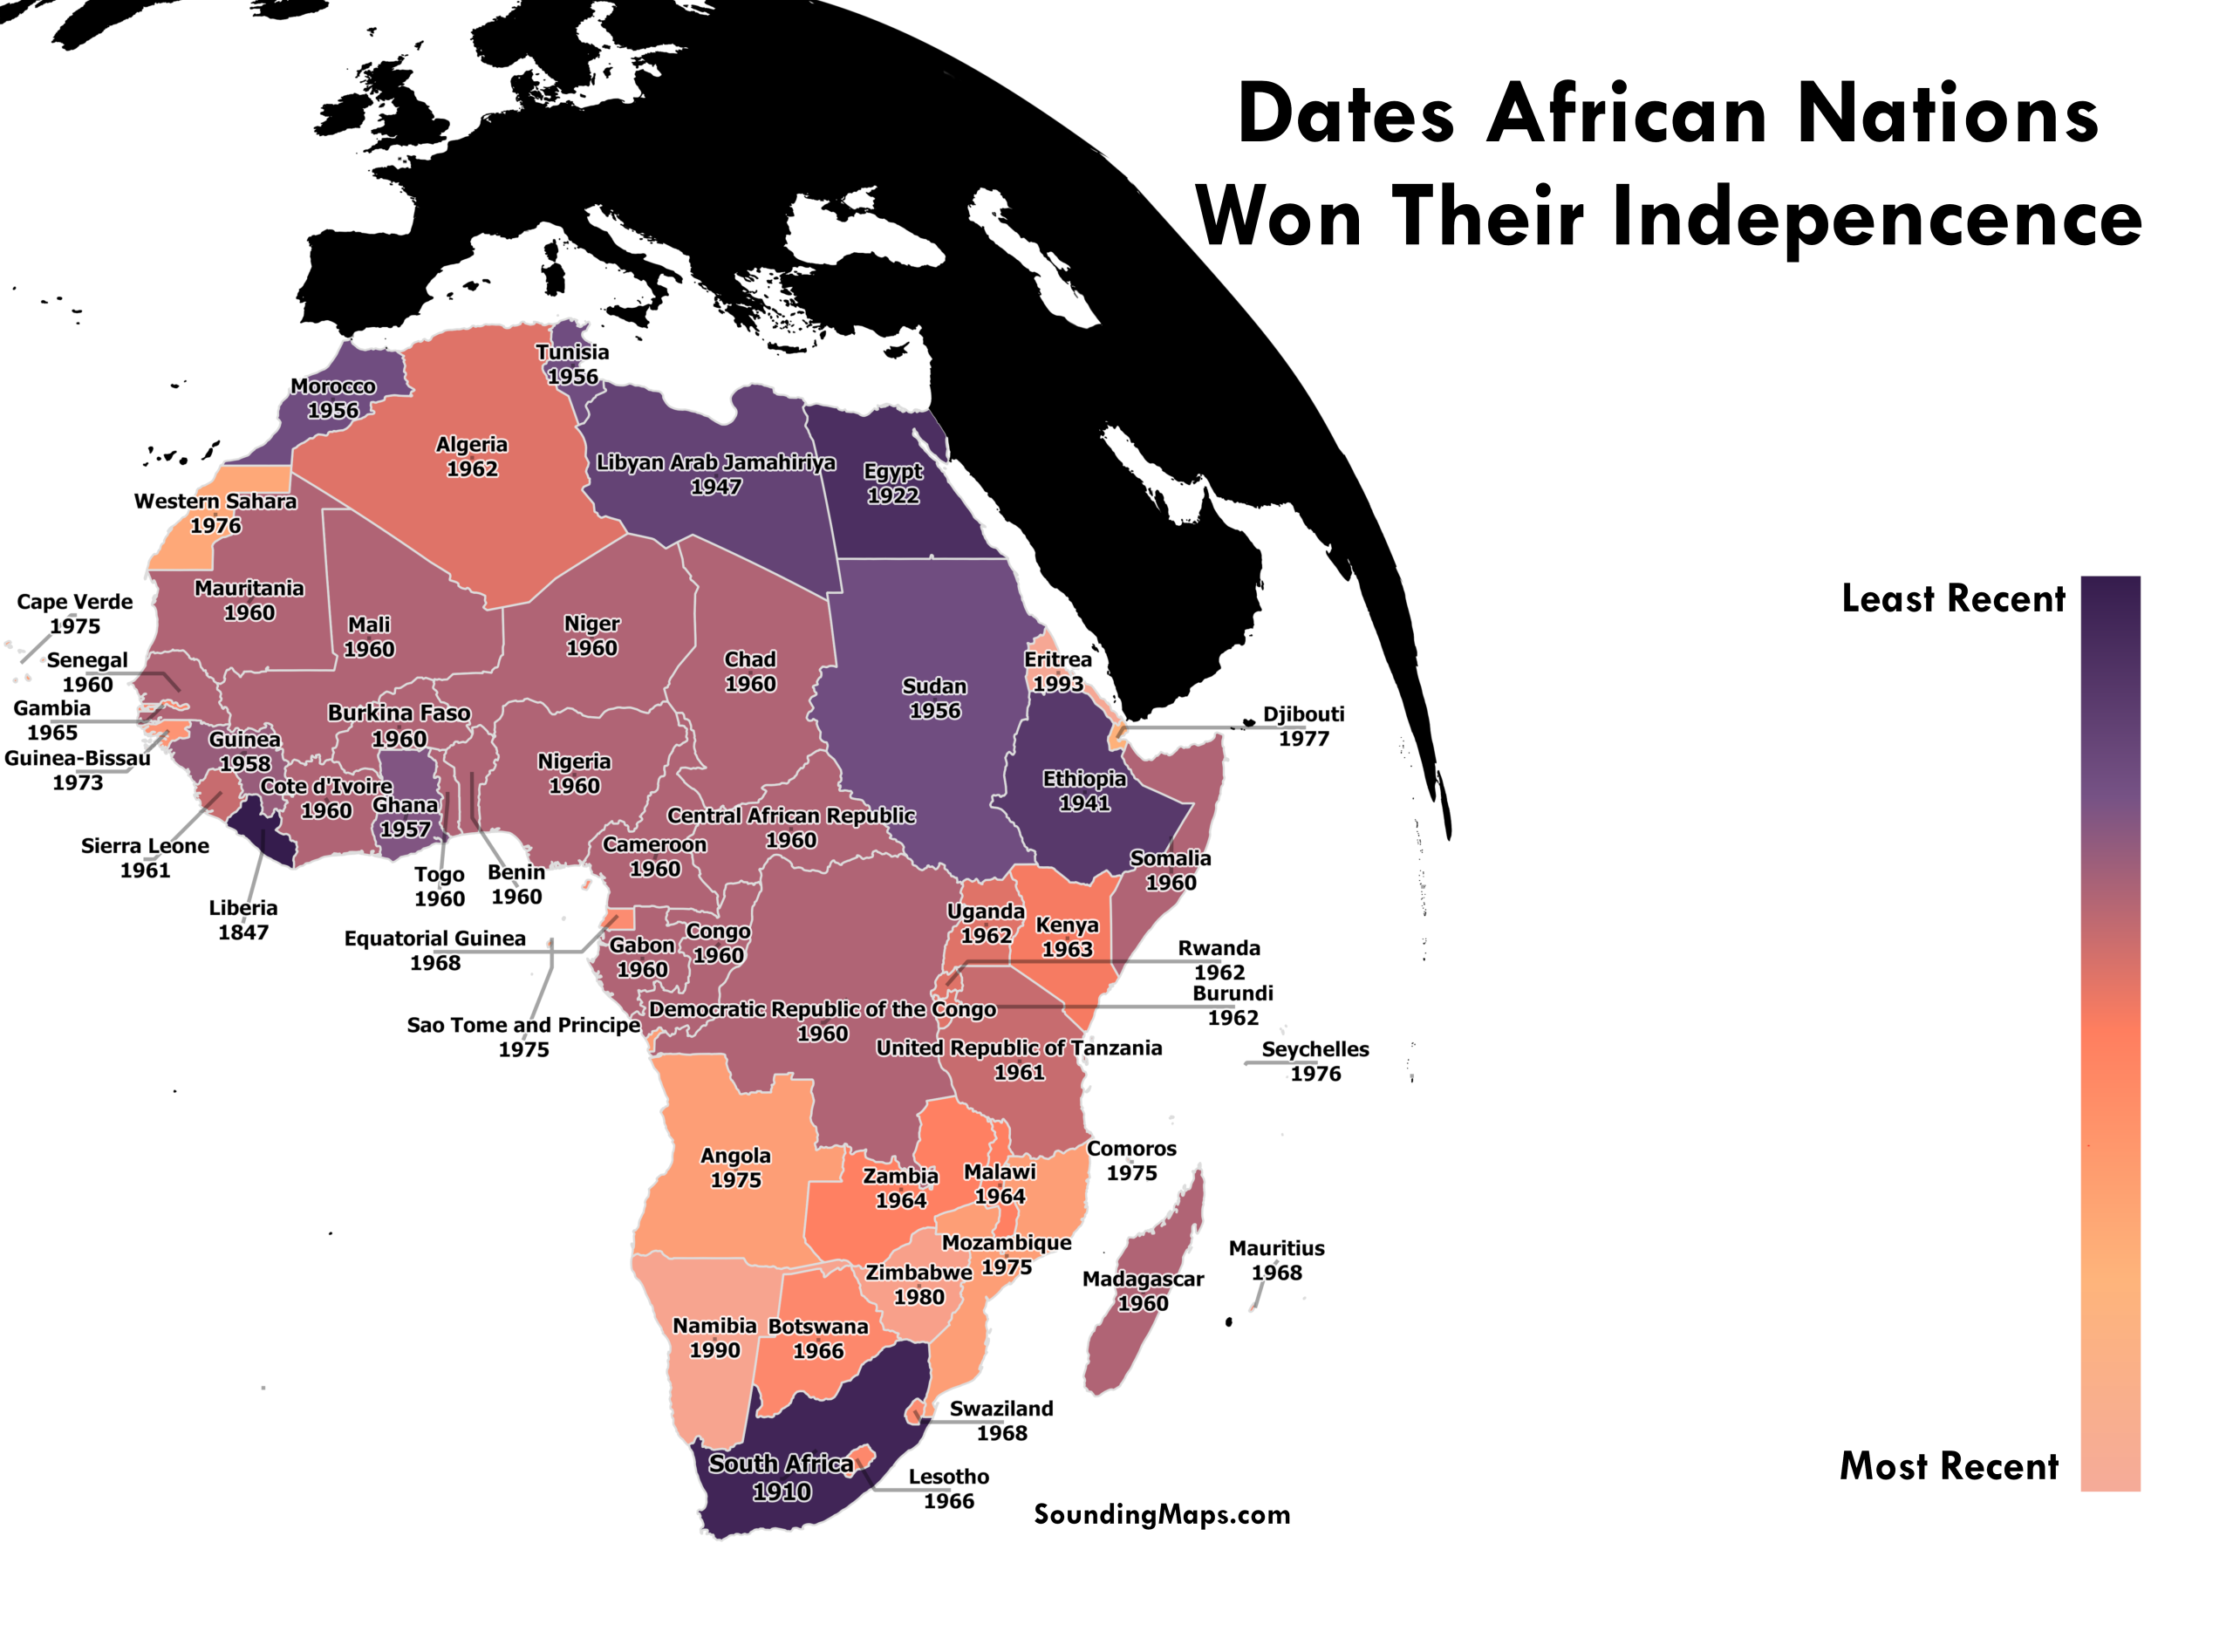
The Year of African Independence Dates This map shows each African nation’s independence dates. 1960 is referred to as The Year of Africa, mainly because of the independence of seventeen African countries. Most gained independence from Belgium, France, and the United Kingdom. Following most African colonization between 1880 and 1900, the struggle […]
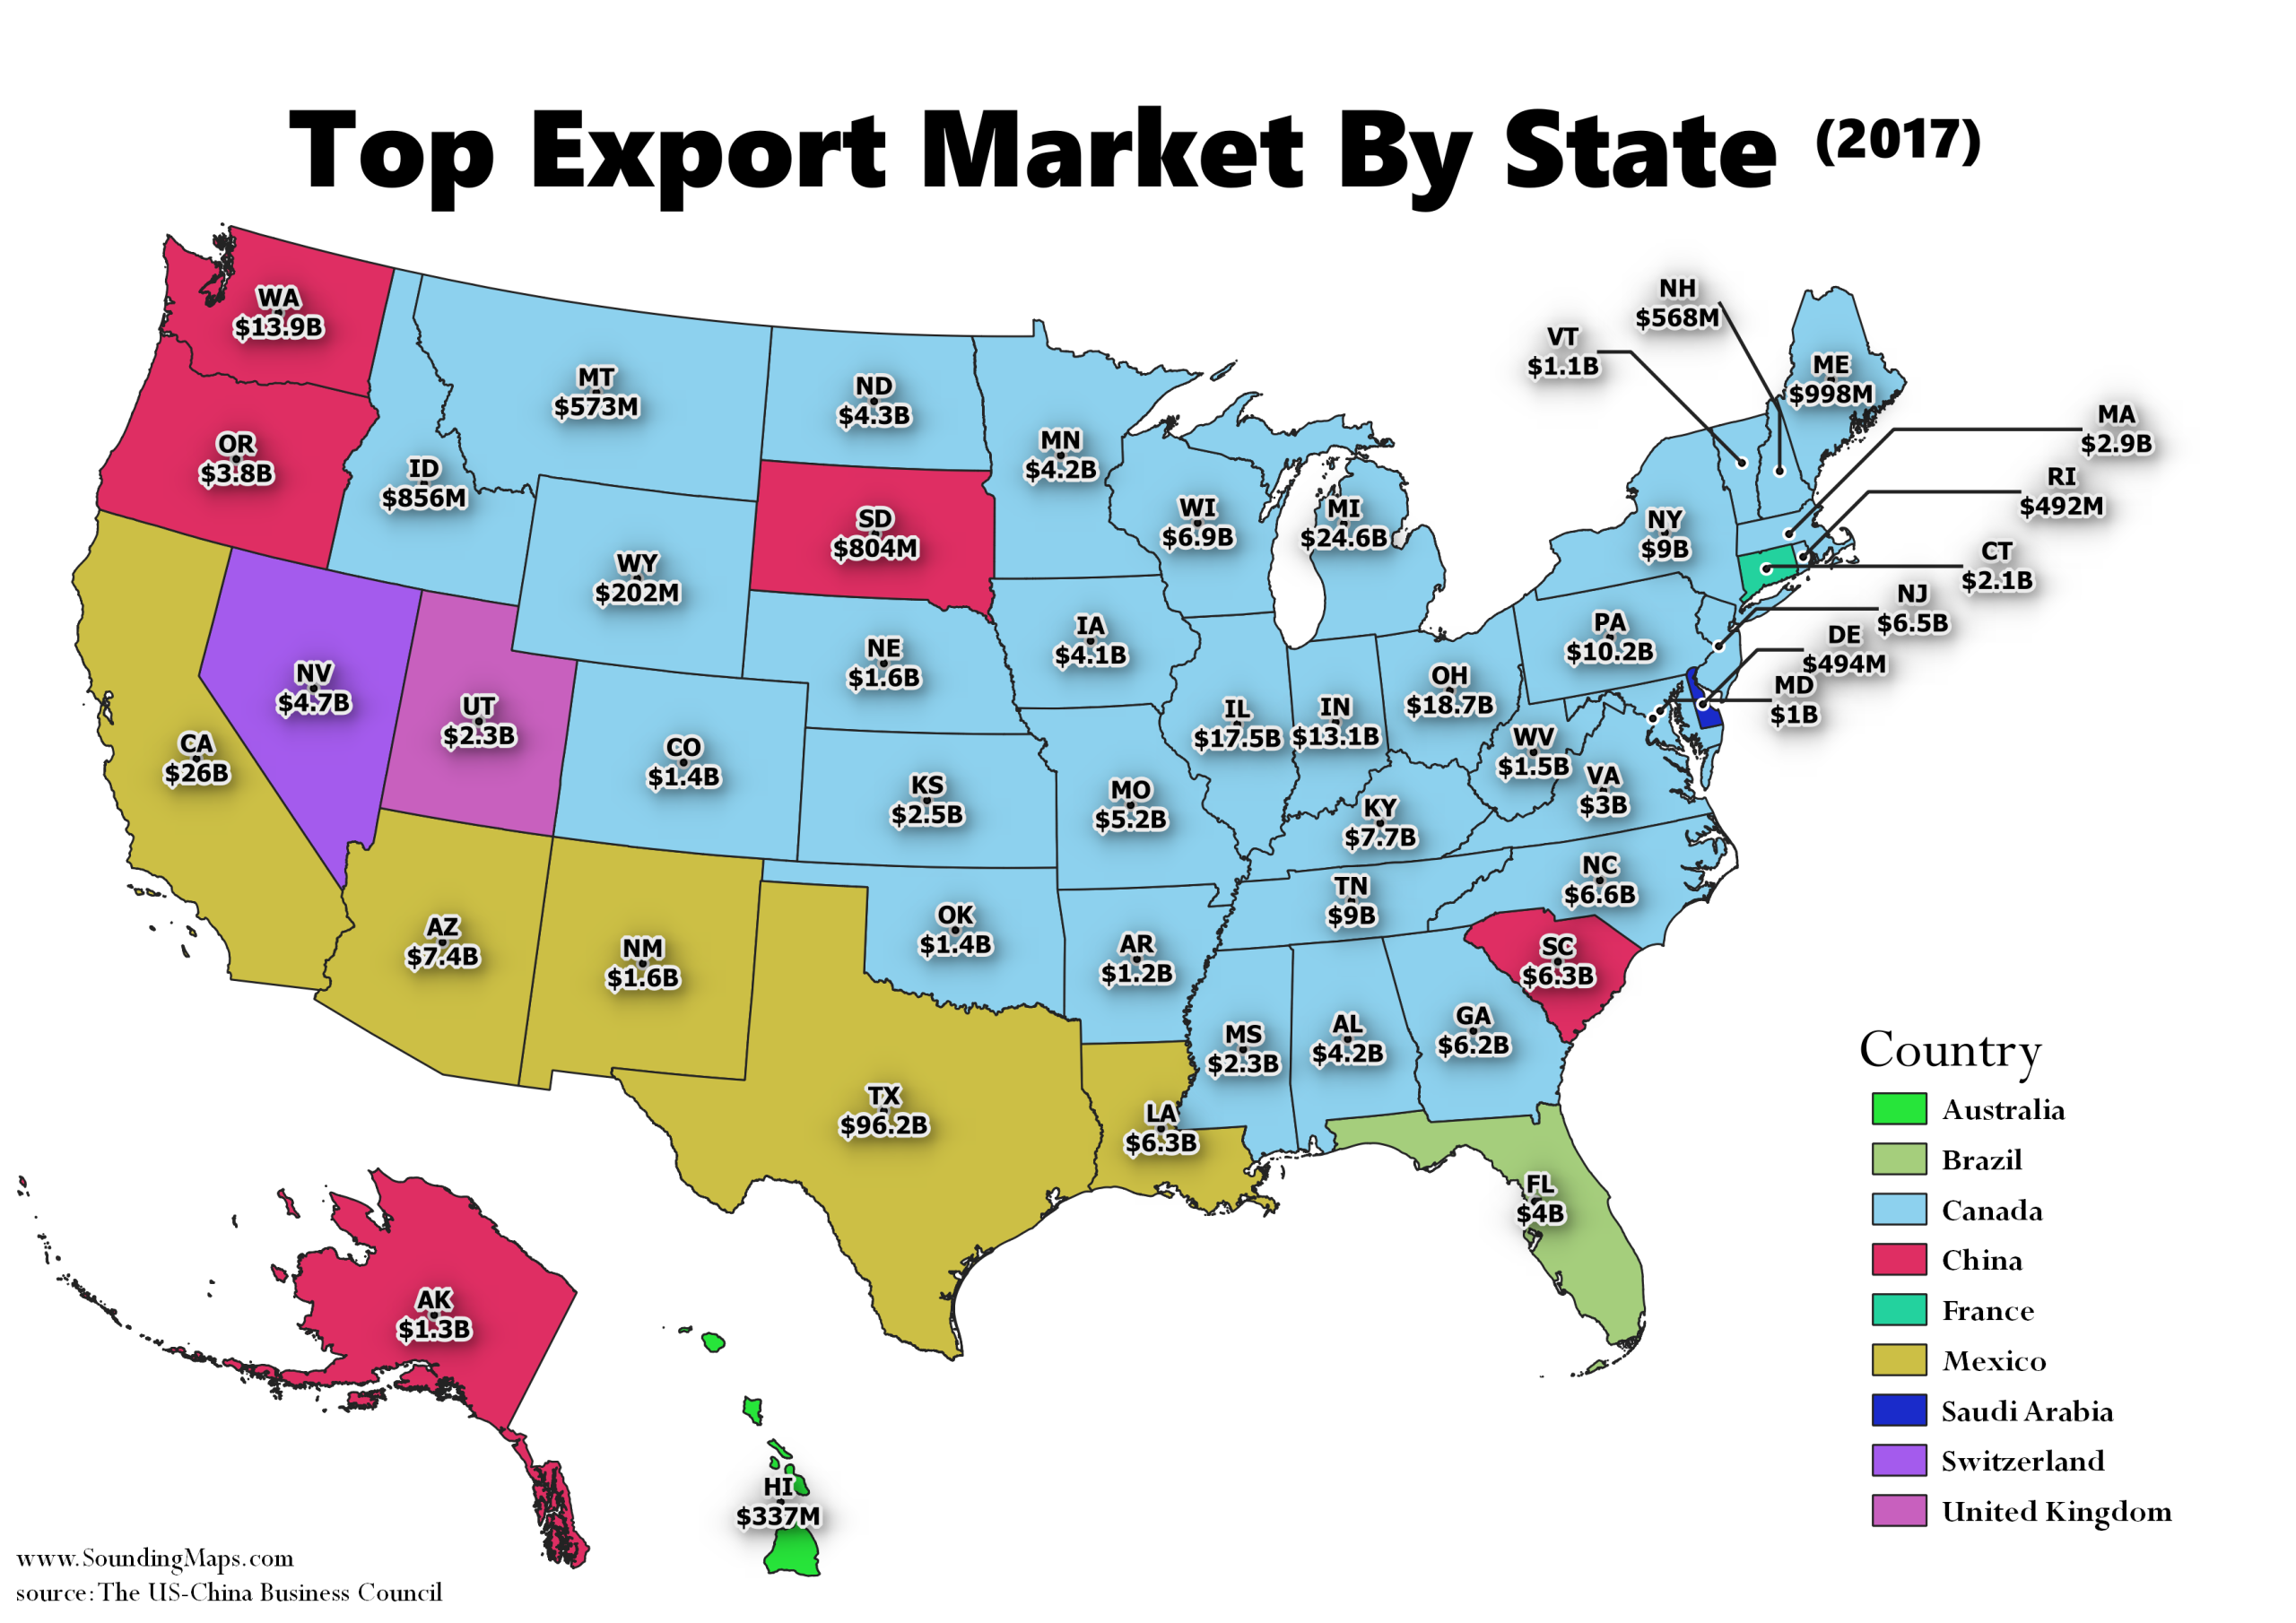
This map shows the United States biggest export markets for each state. In 2017, Canada was the United States biggest export market for 33 states, and exports to Canada across the country totaled $282.3 billion. Both China and Mexico are the top export market for 5 states. The top exports to […]
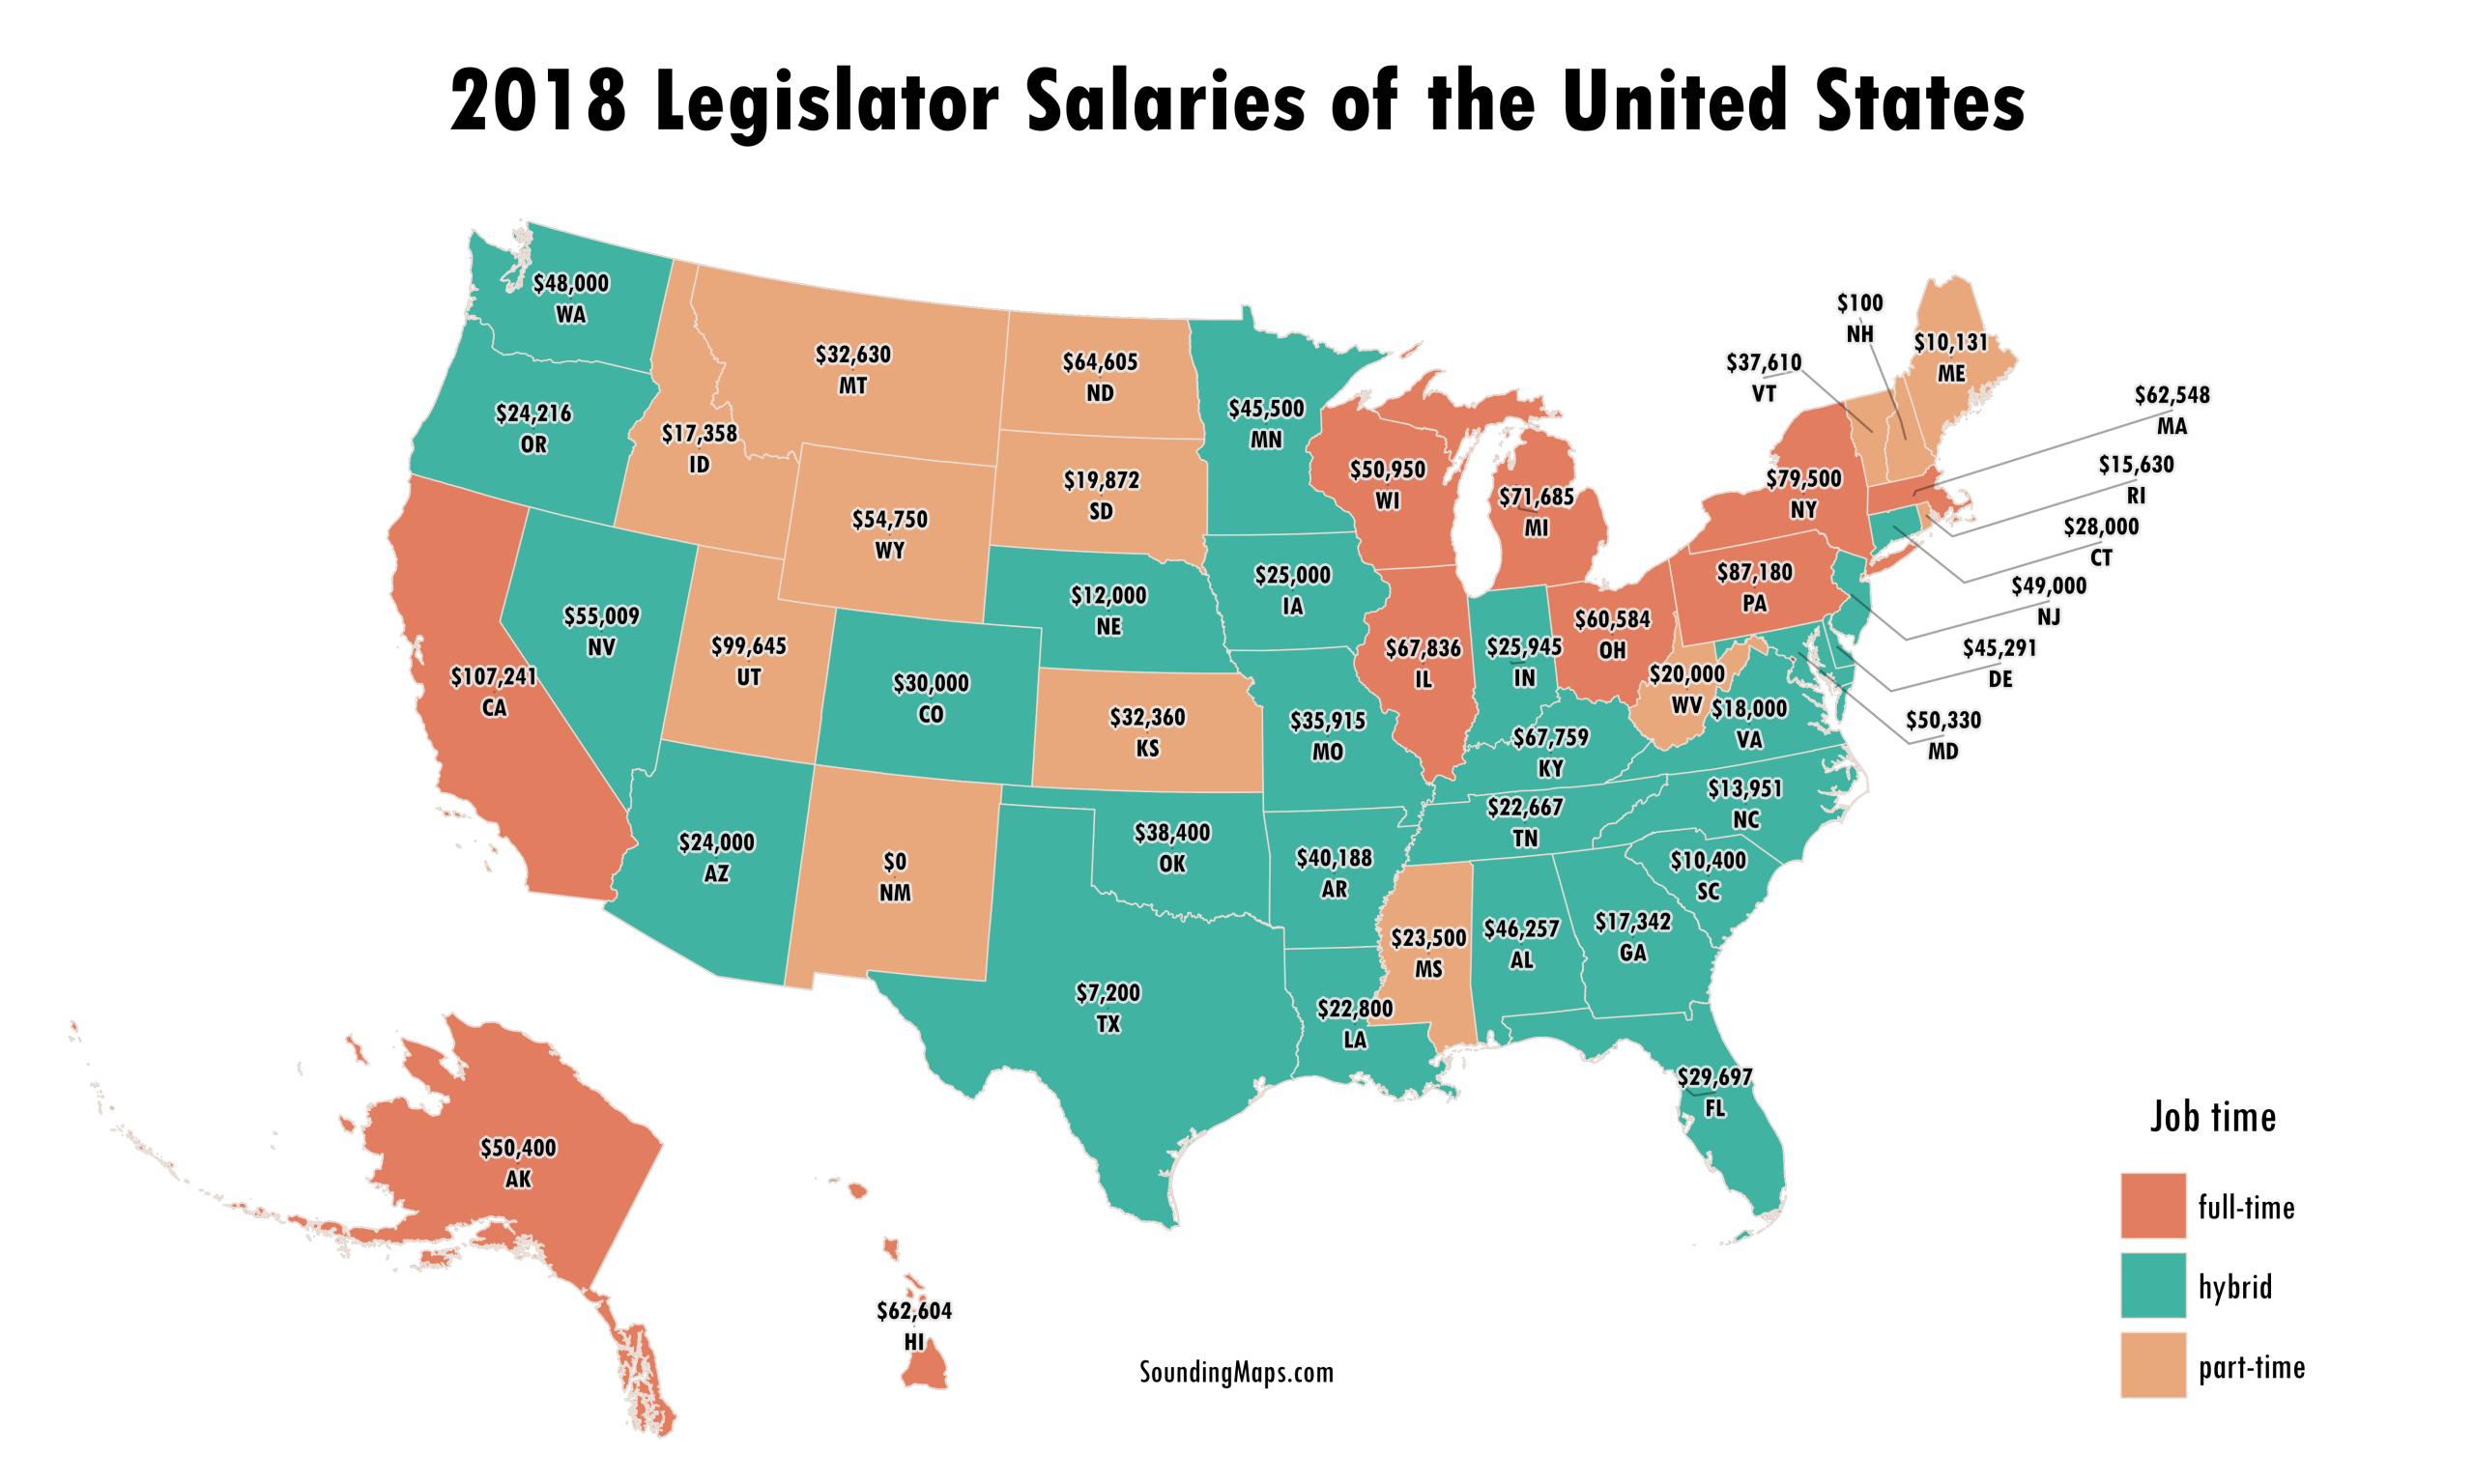
Have you wondered what your state legislators make for a salary? Ever care to think what the people making your laws are paid? To be honest, not really. Although I was a bit surprised to learn the amounts. This map shows various US legislator salaries including senators and representatives. There […]
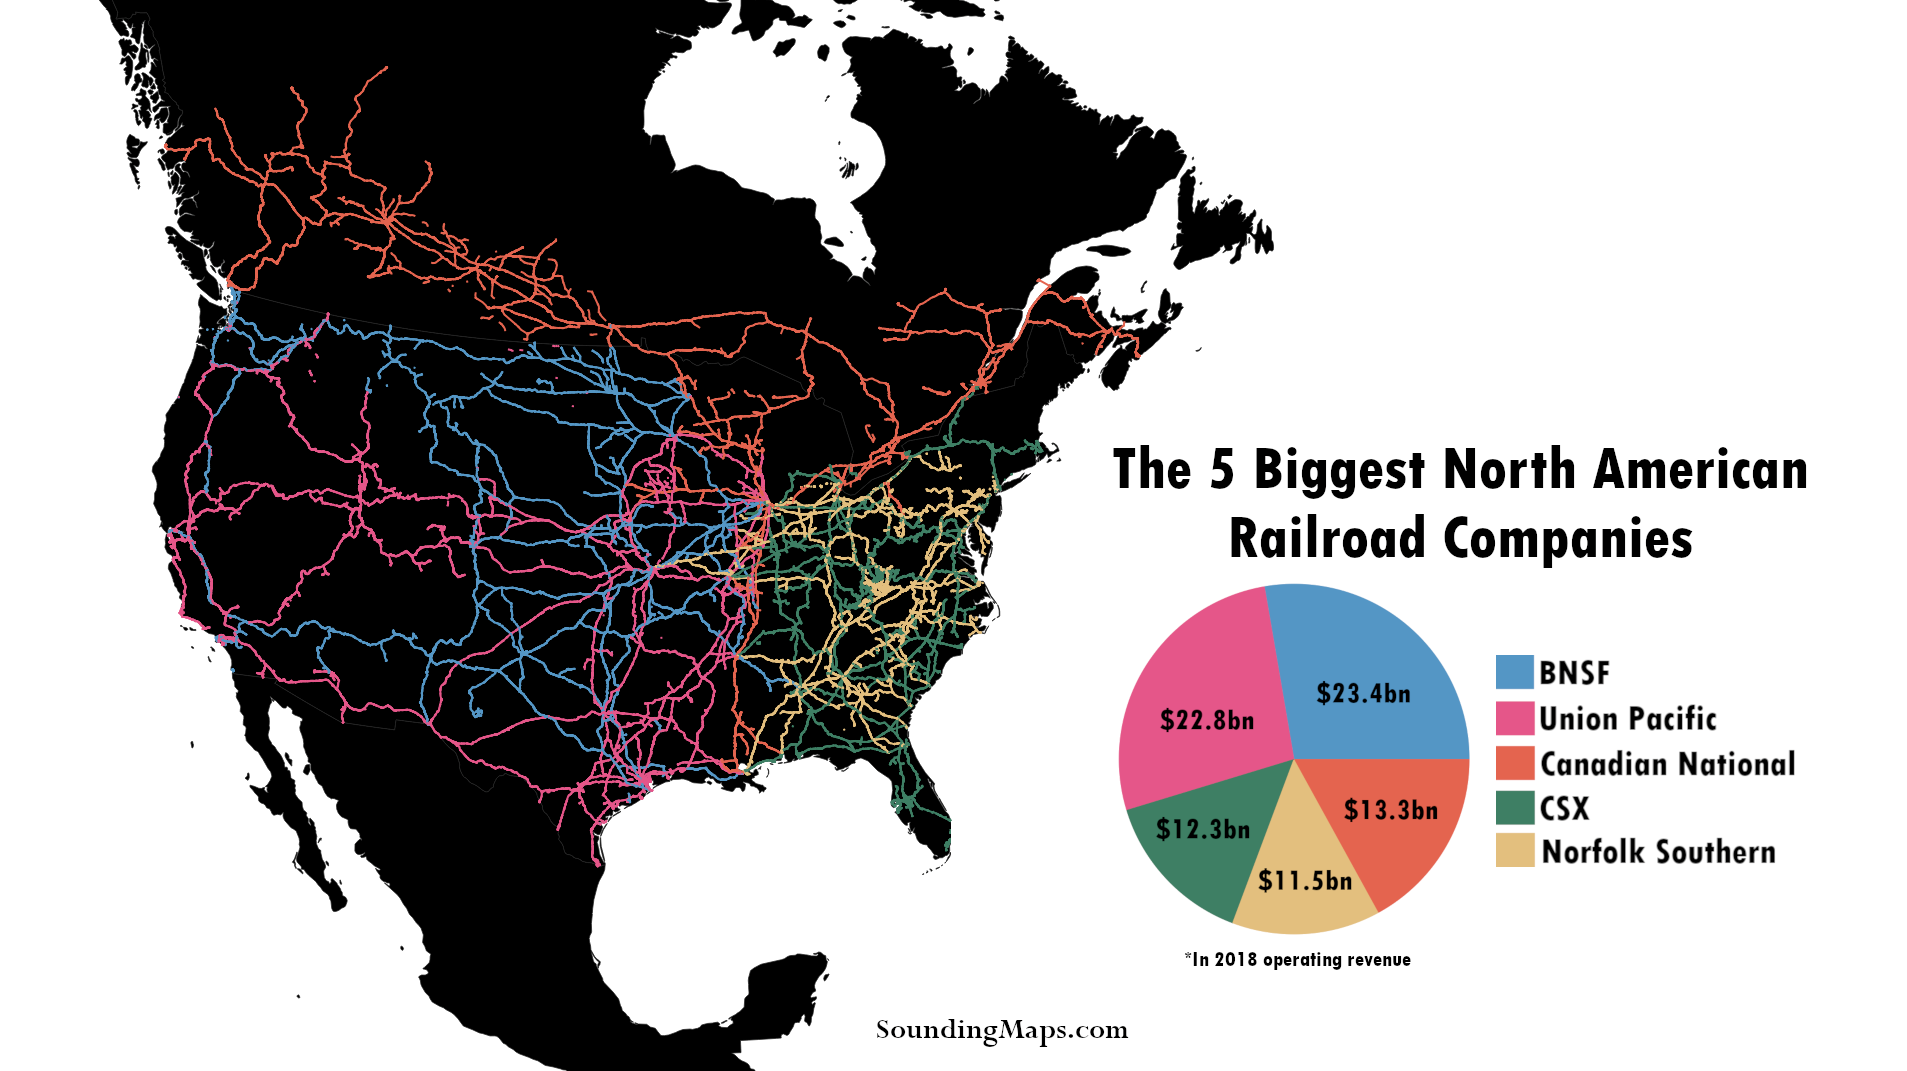
Now, categorized by operating revenue, this is the North American biggest railroads map. The USA rail network is dominated by 5 railroad companies. Read below to see how the 2025 railroad revenue’s compared. The Largest US Railroads Union Pacific is mapped in pink throughout the western United States against BNSF […]
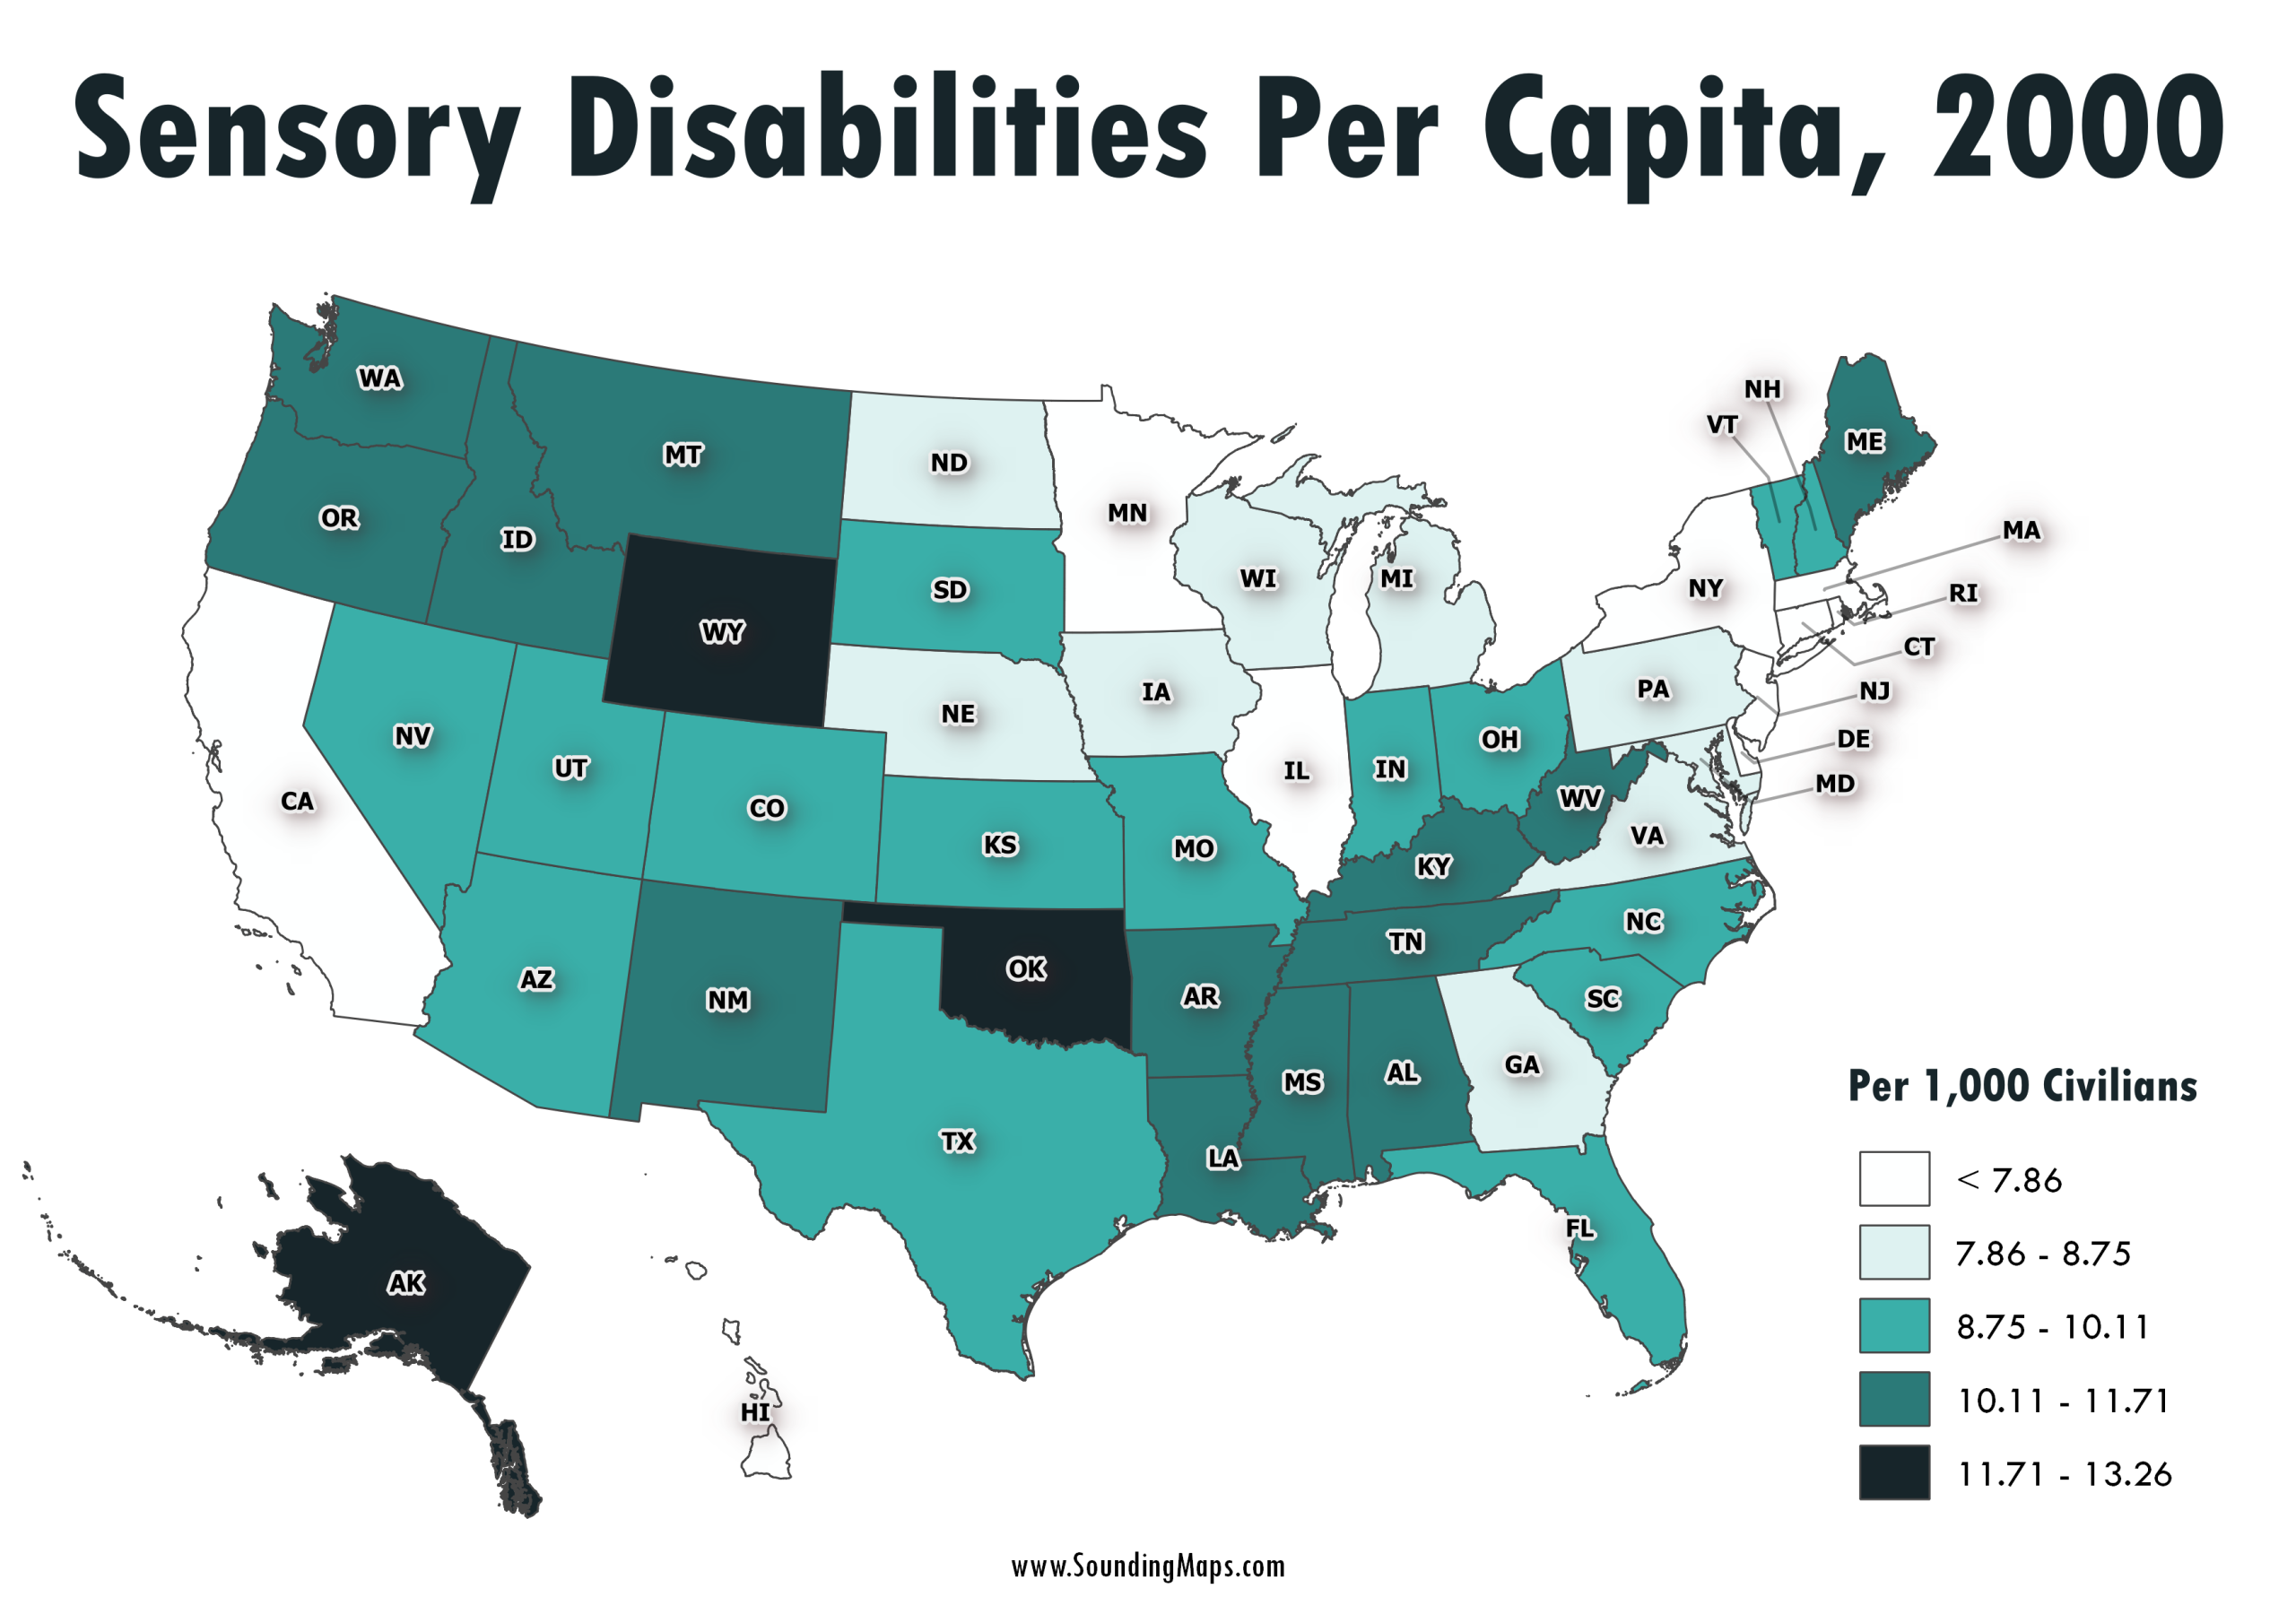
This map shows sensory disabilities throughout the United States in the year 2000. The color coded regions represent disabilities per 1,000 civilians. For instance, Alaska had 12.26 sensory disabilities per 1,000 citizens. Census 2000 counted 49.7 million people with some type of long lasting condition or disability. They represented 19.3 […]
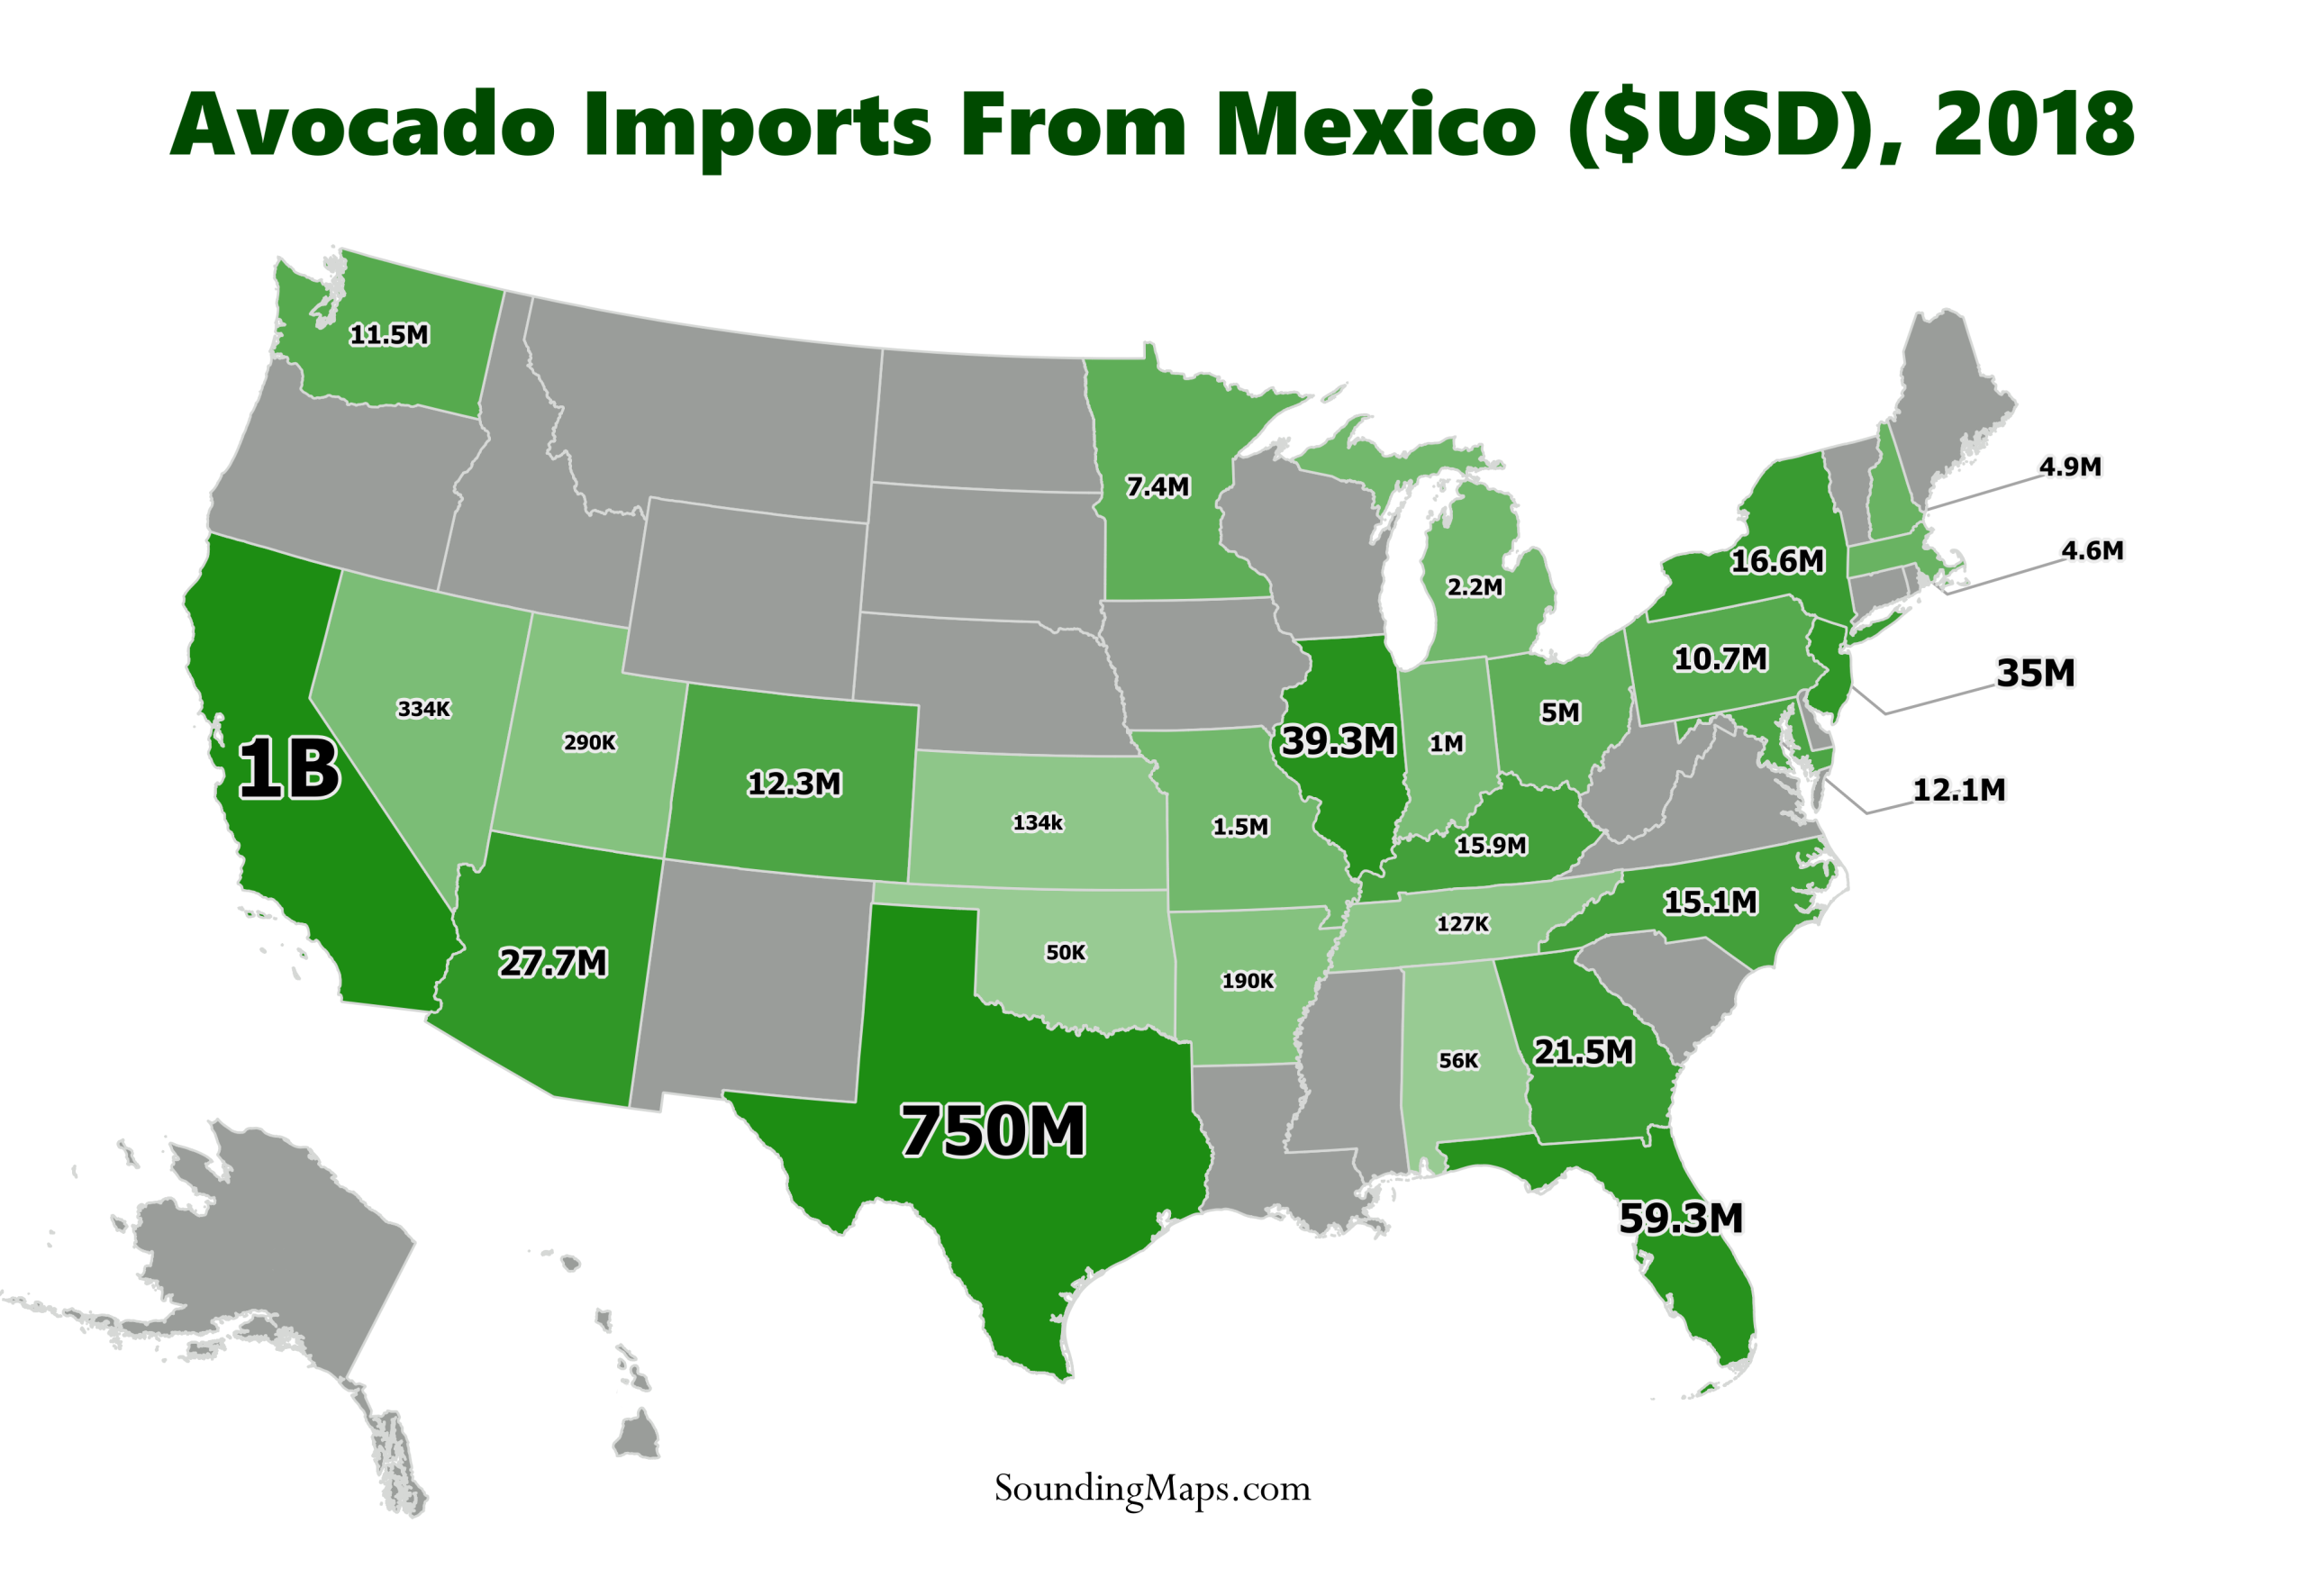
In light of Trump’s threats to close down the border and his recent retaliation of extending his trade war by threatening to impose tariffs against Mexico, this map demonstrates the impact of US avocado imports against Mexico. In 2018, the avocado imports from Mexico generated the country approximately $3 billion. […]
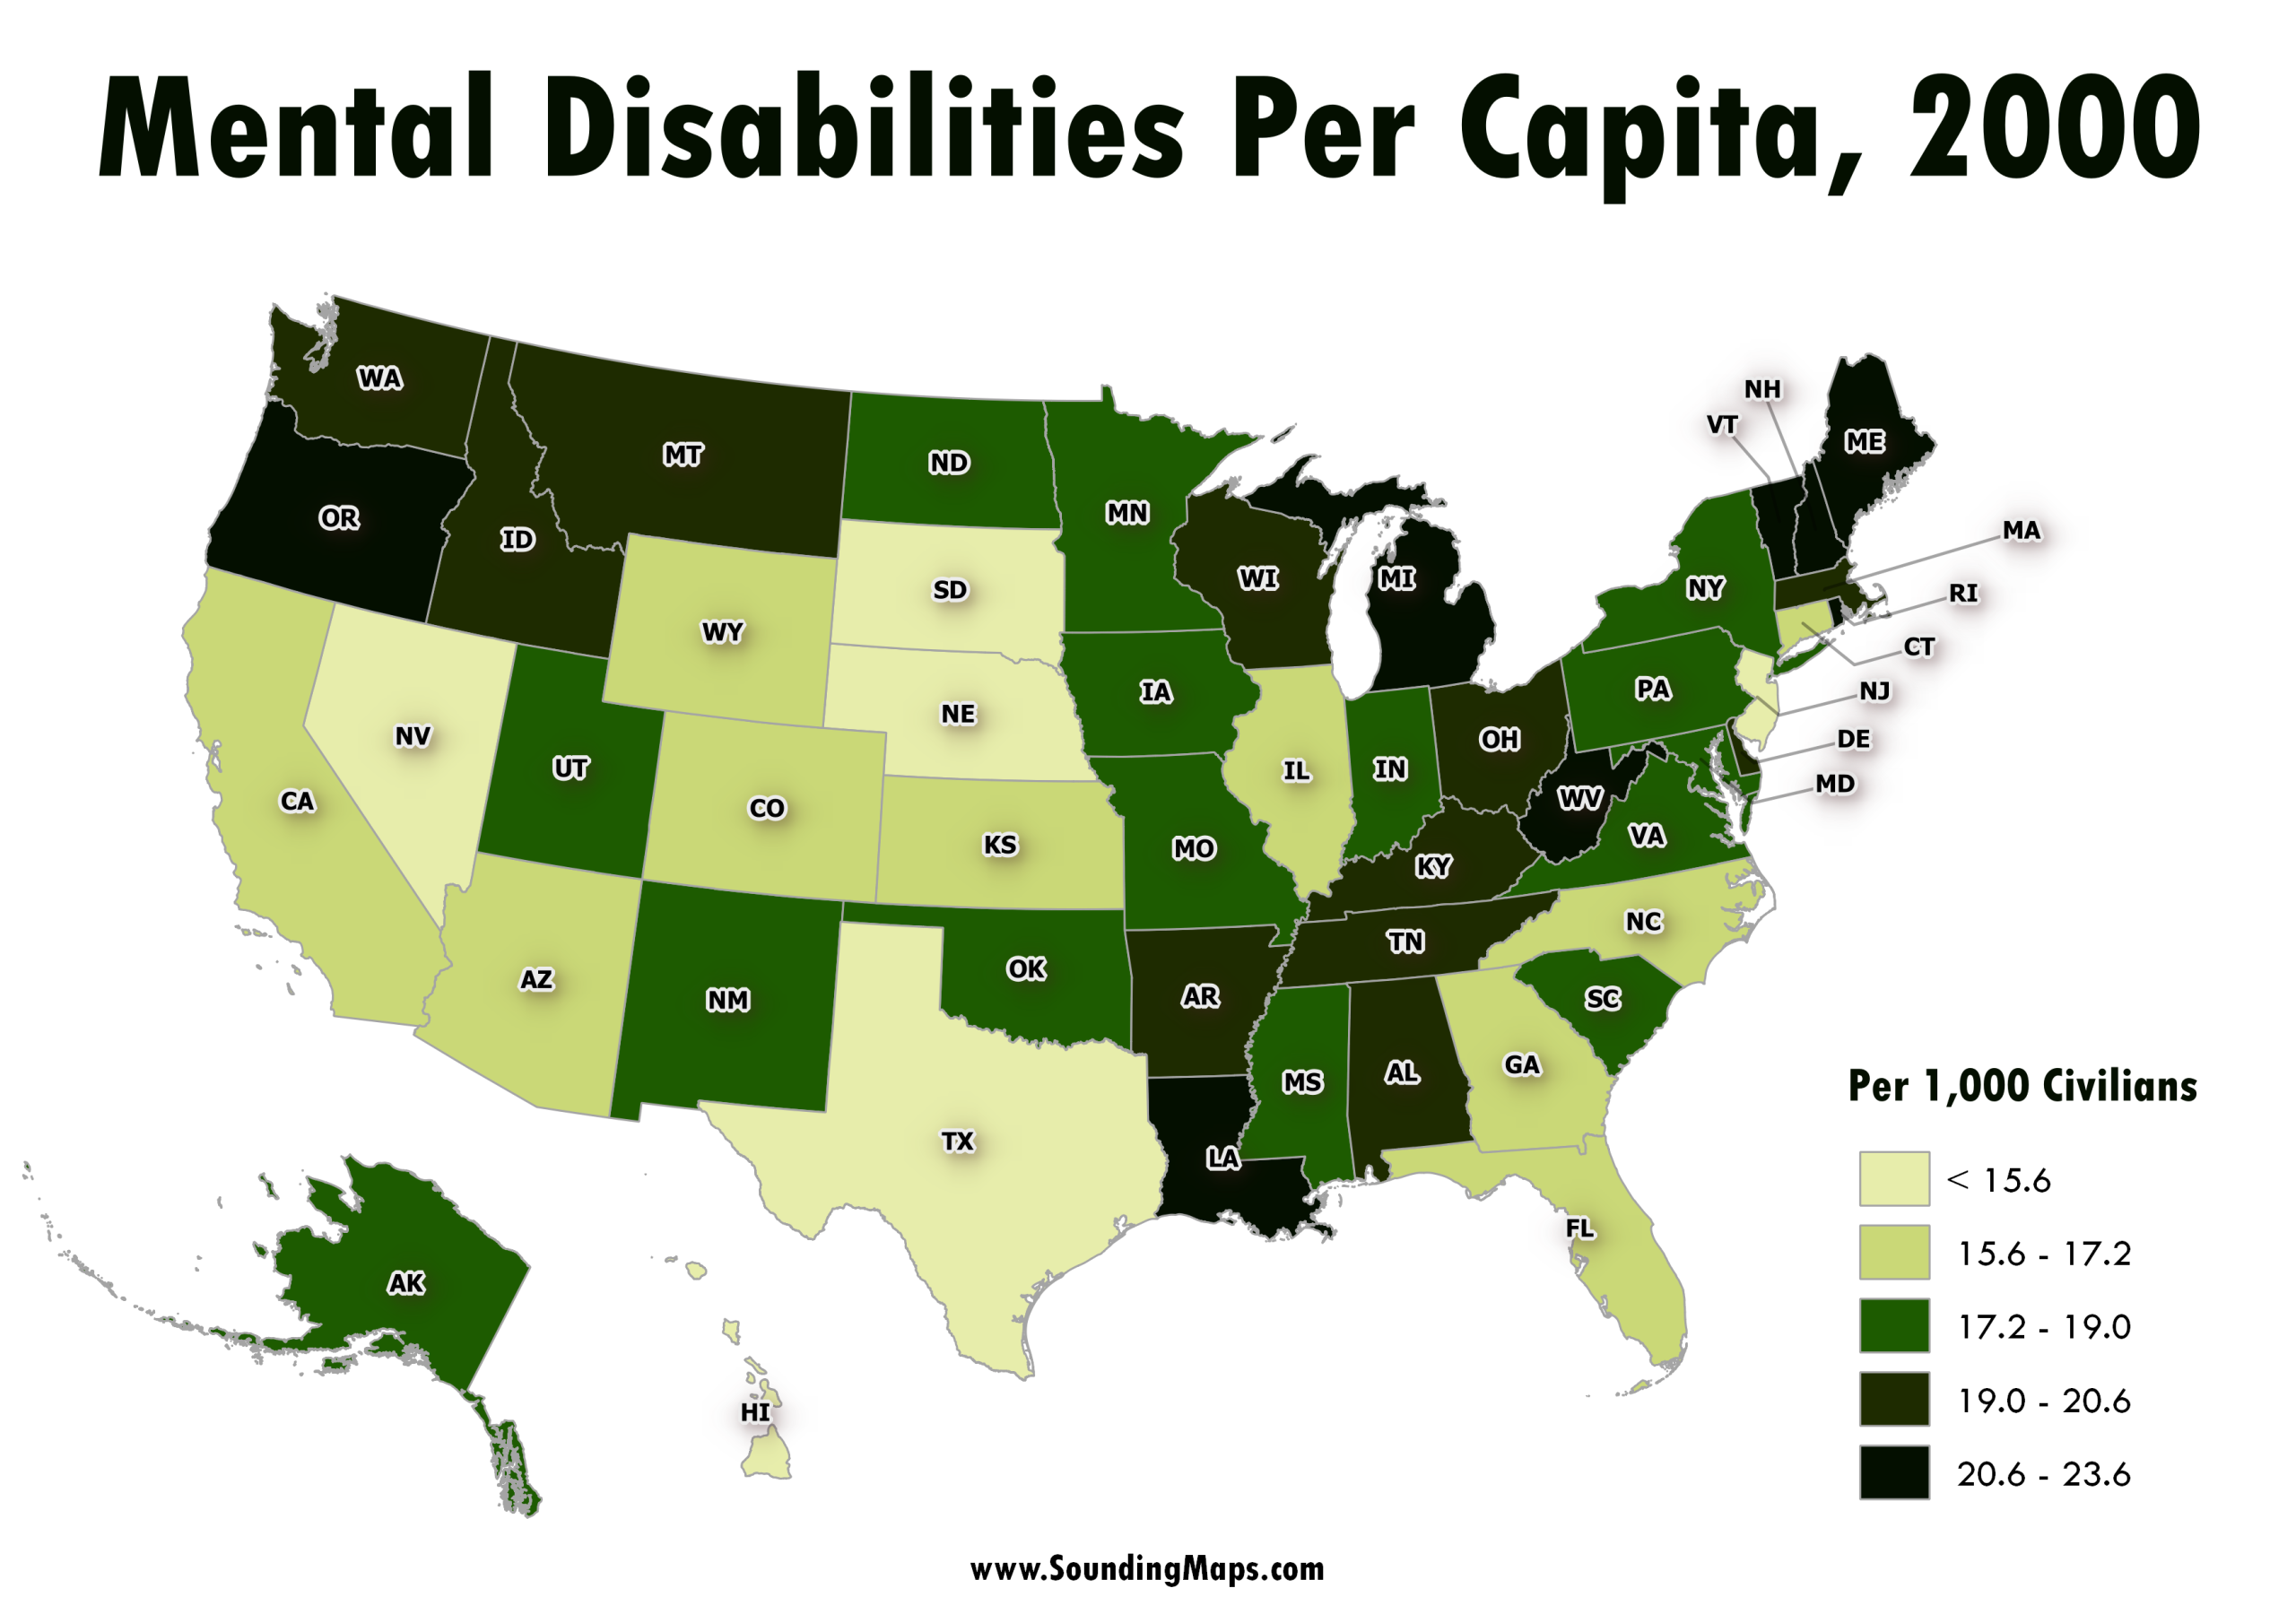
This map represents the mental disability status of the civilian non-institutionalized population of the United States regions in the year 2000. Census 2000 counted 49.7 million people with some type of long lasting condition or disability. They represented 19.3 percent of the 257.2 million people who were aged 5 and […]
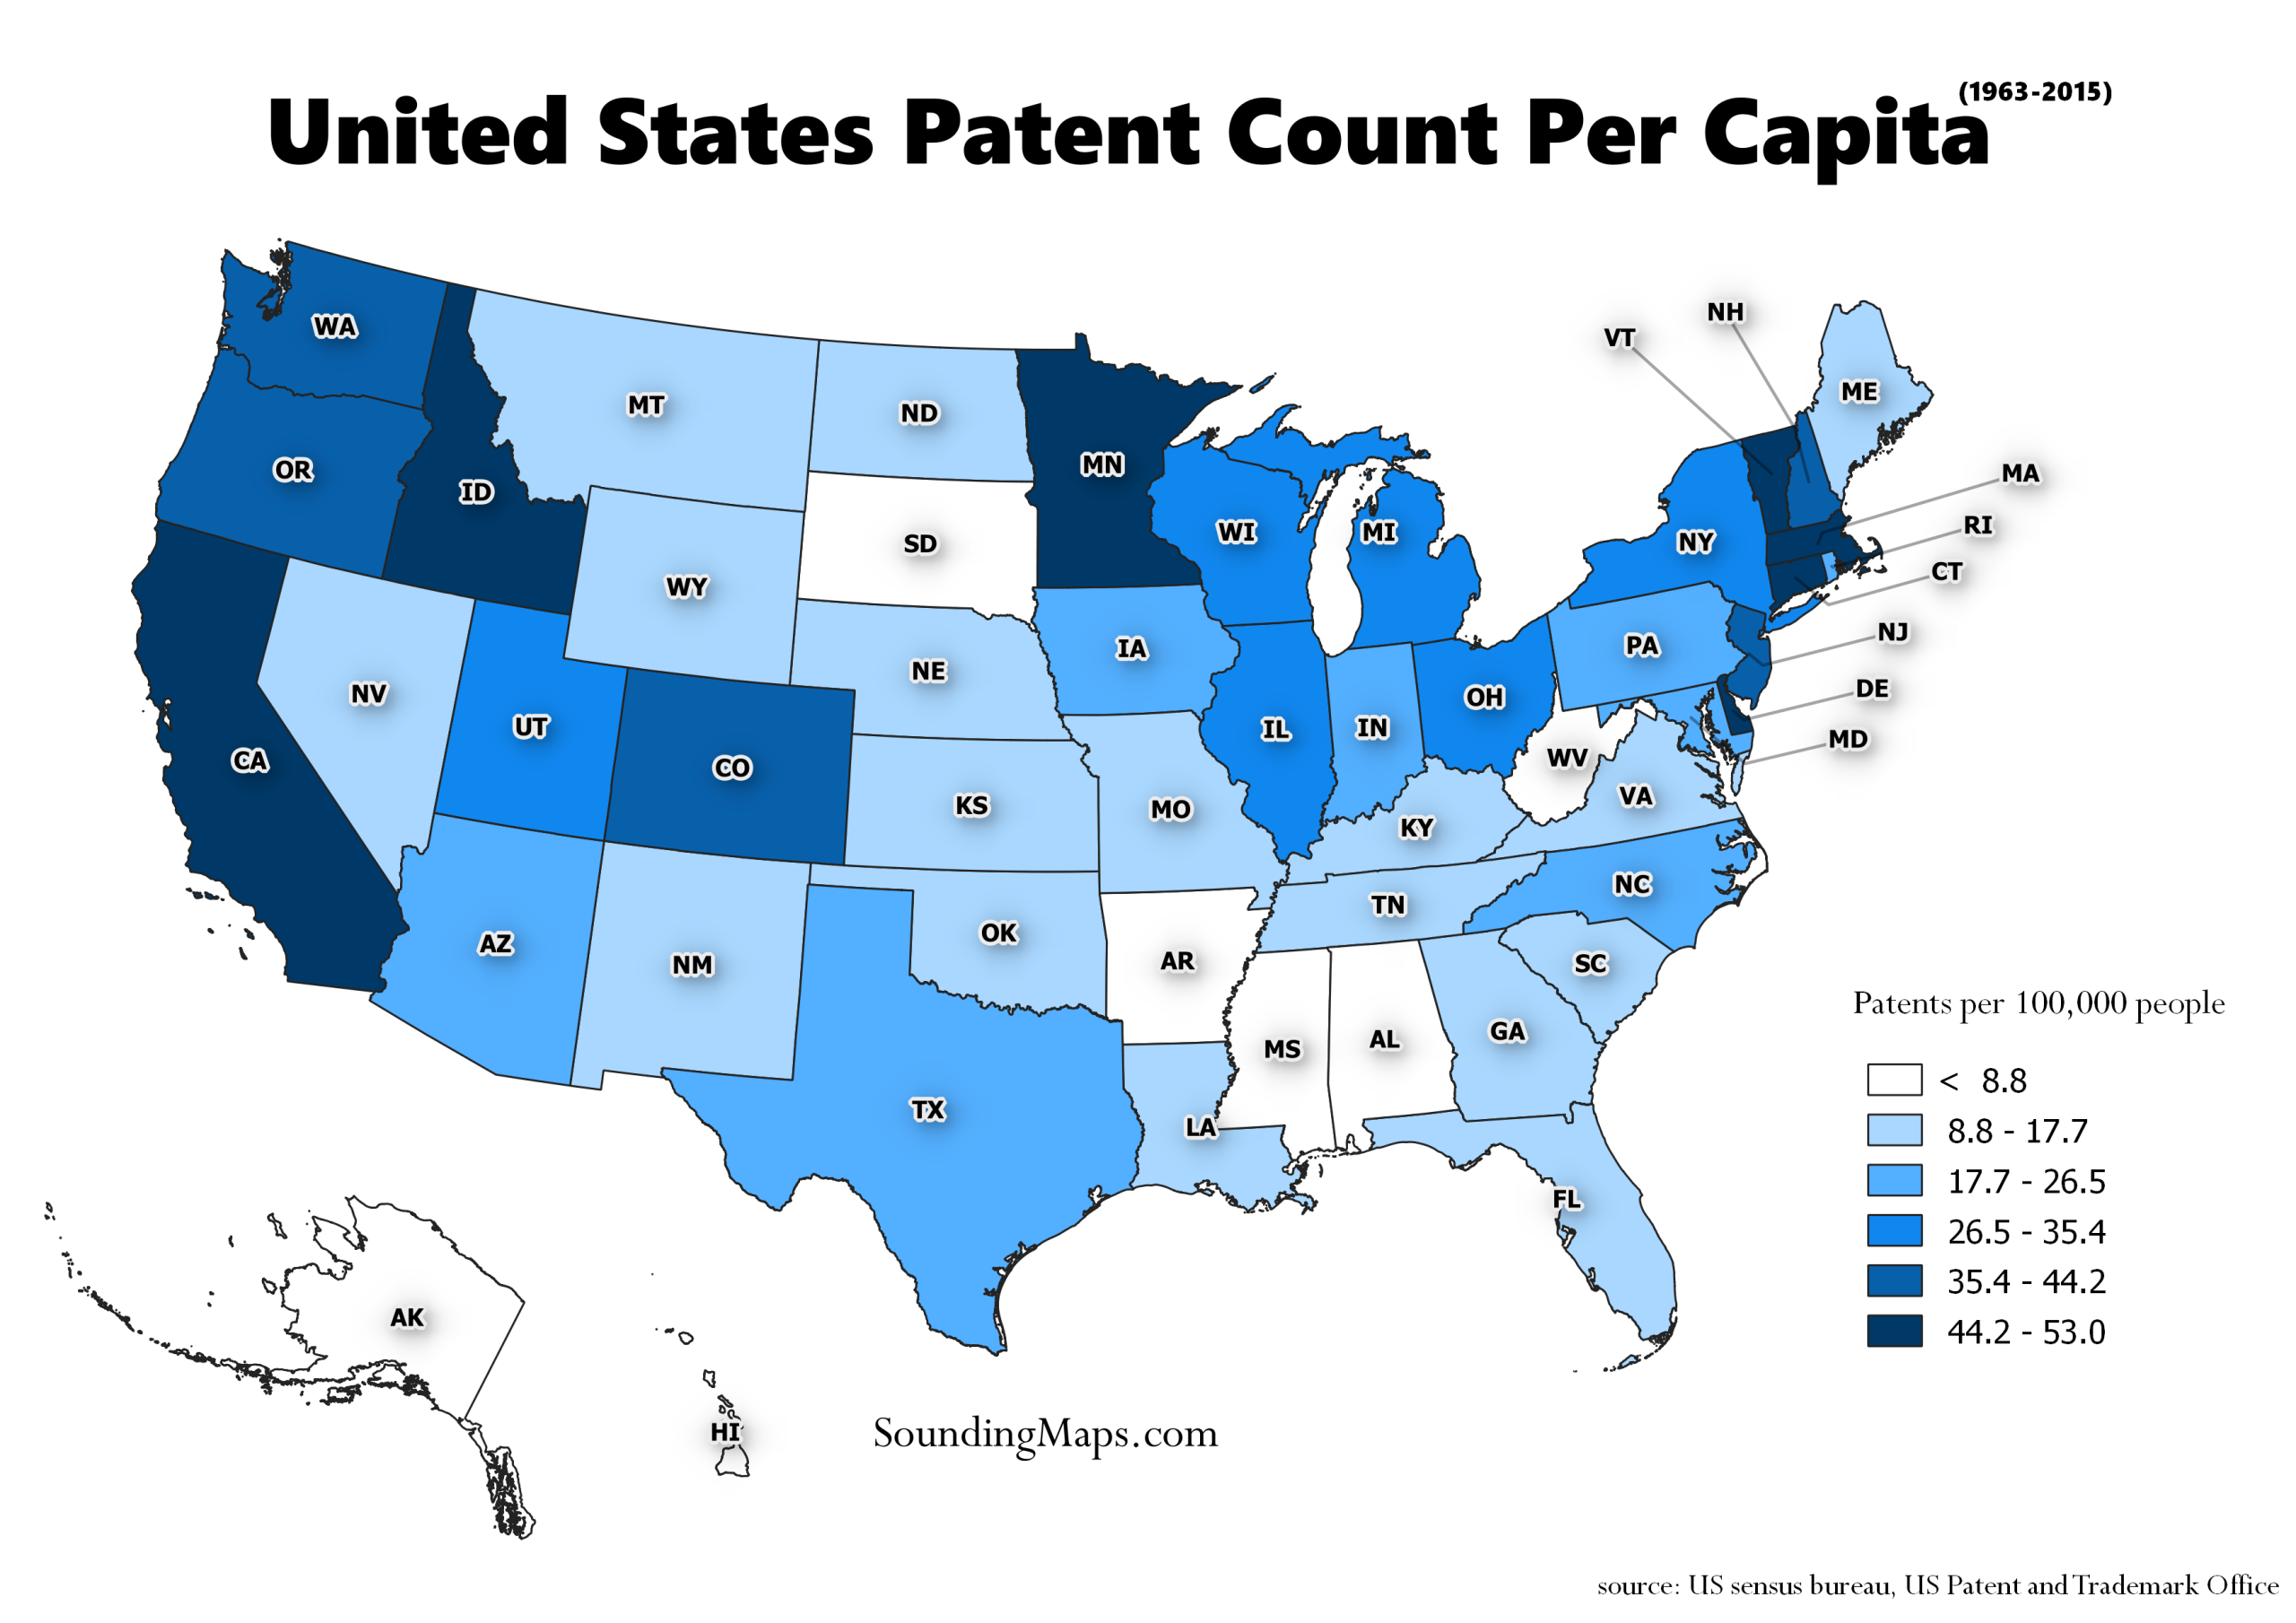
Overview of States with the most Patents This map visualizes the States with the most patents during the period 01/01/1963 – 12/31/2015. The residence of the first-named inventor determines the origin of a patent. Since the data comes from nearly half a century we normalized it over the years to represent […]
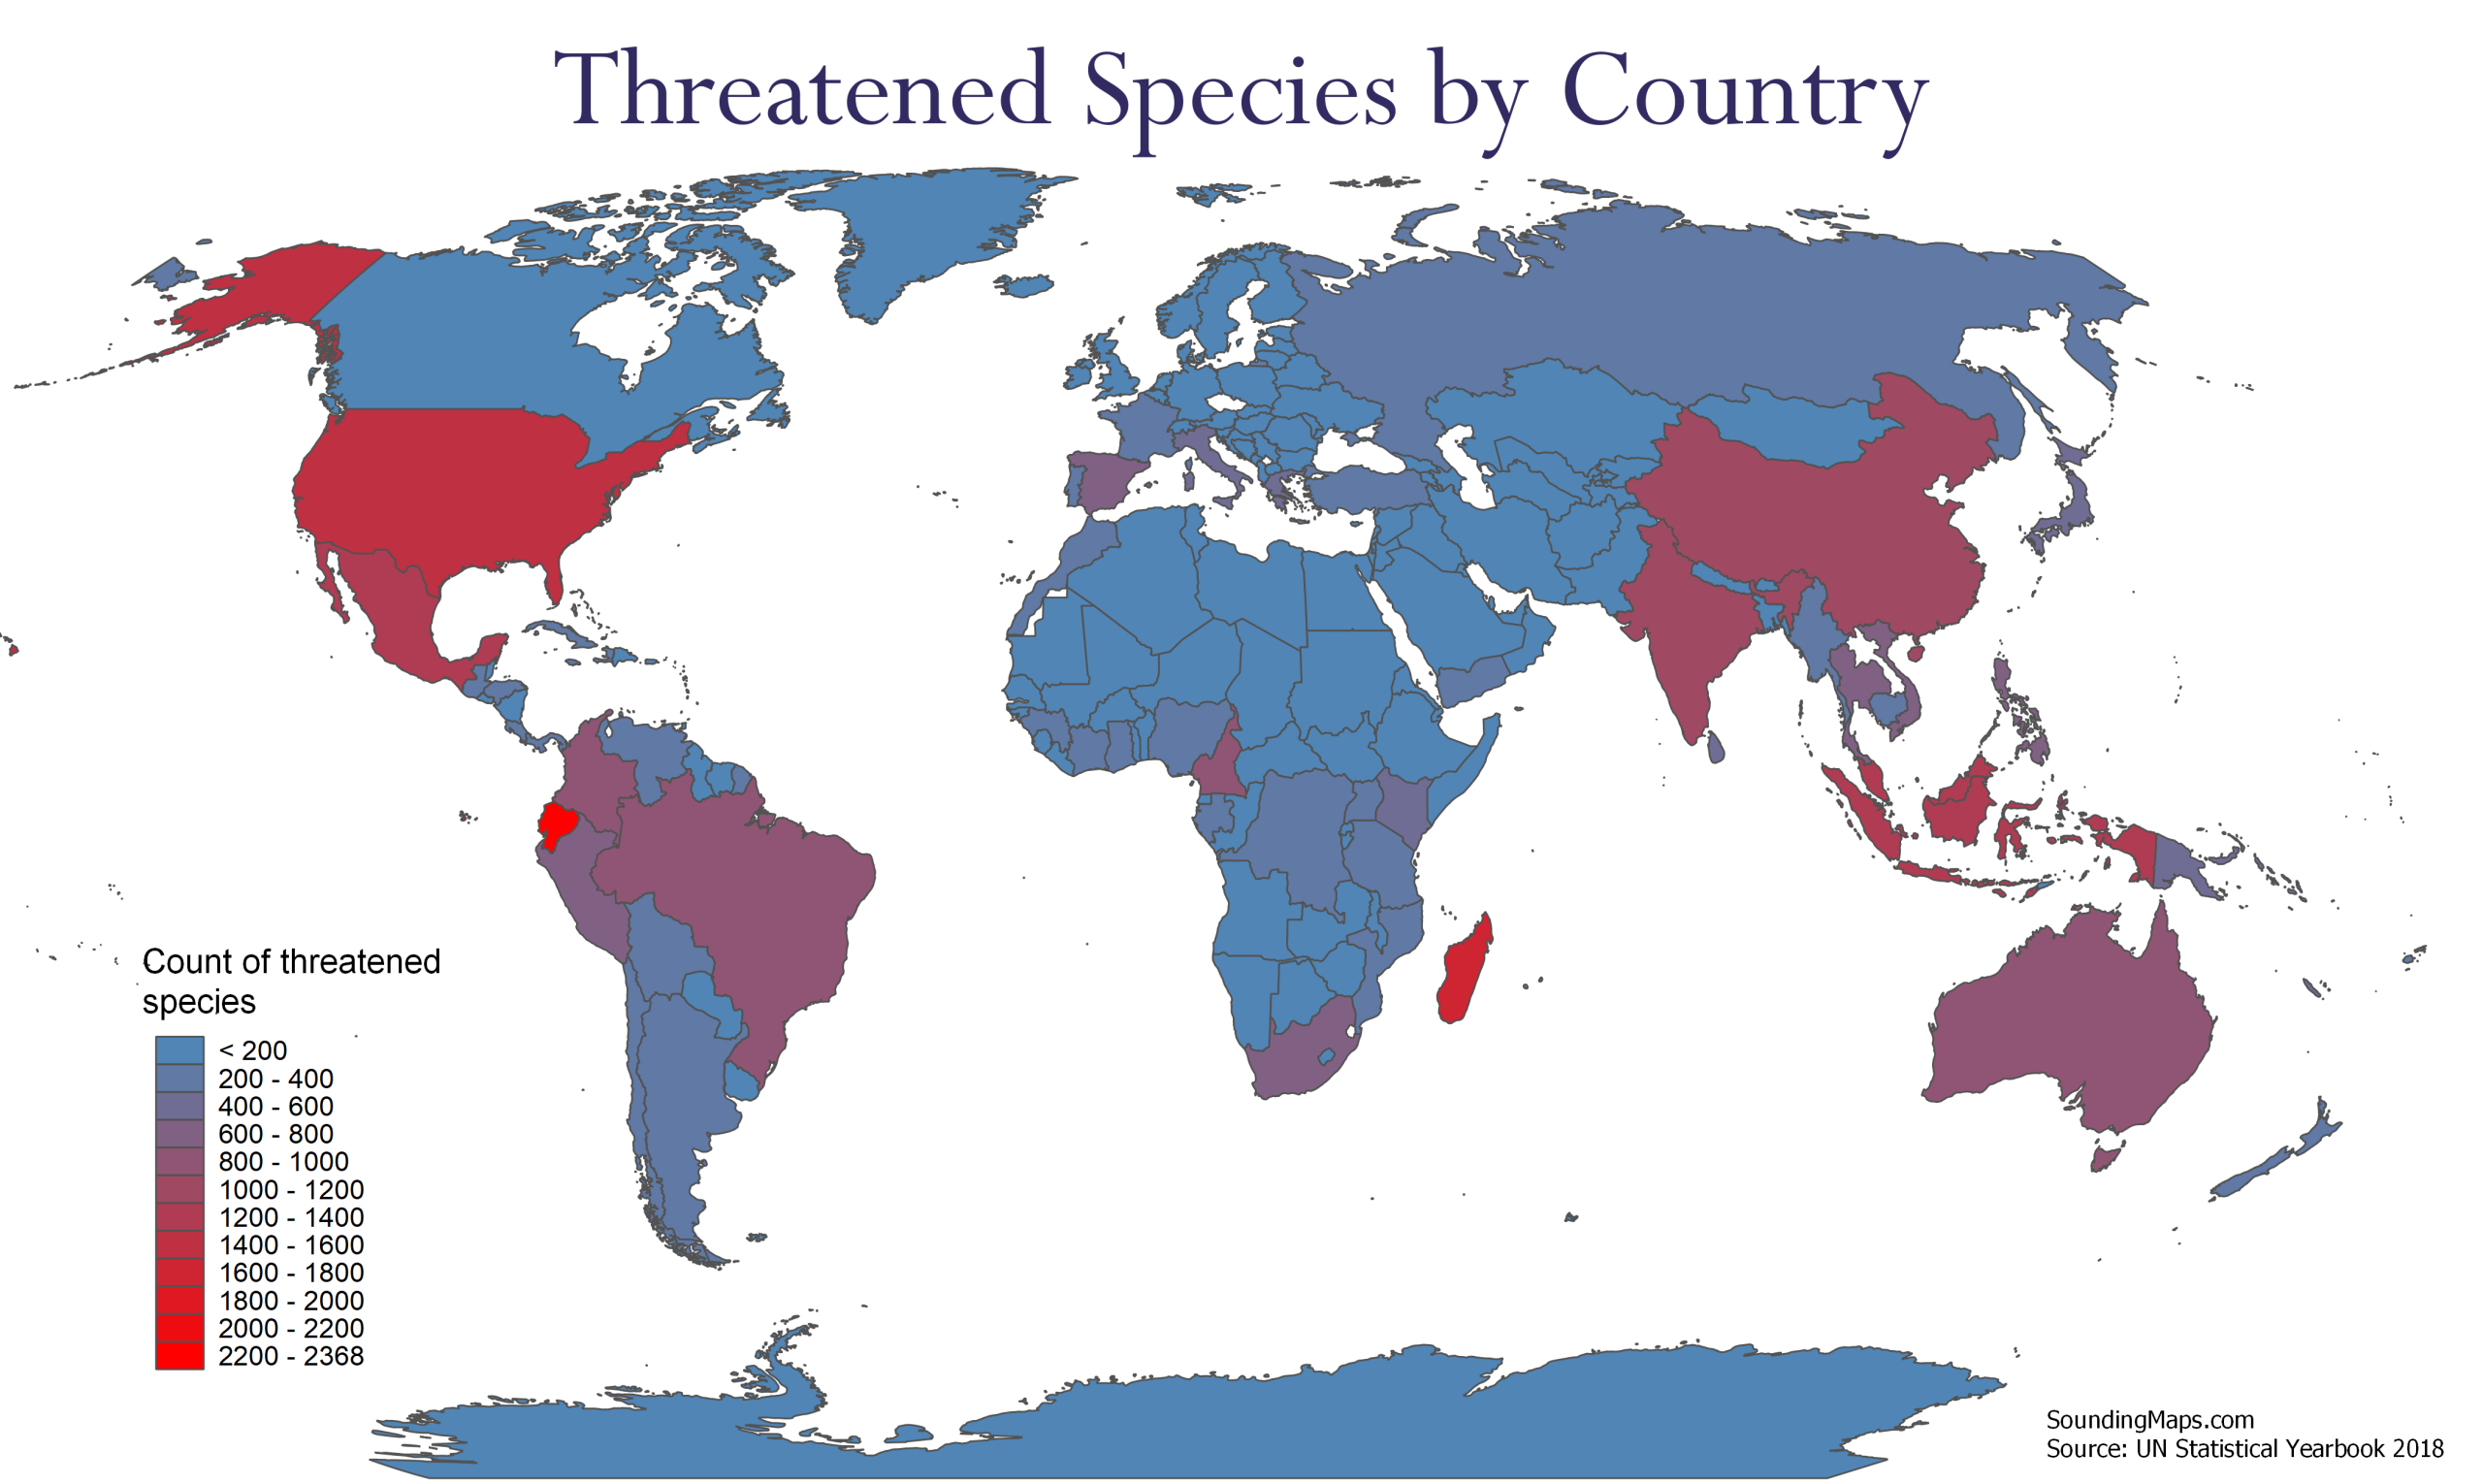
Countries With The Highest Amount of Threatened Species These maps visualizes the countries with a pronounced count of threatened species in 2018. The species include plants, vertebrates, and invertebrates. The threatened category refers to critically endangered, endangered, and vulnerable species. Data was pulled from the 2018 UN Statistical Yearbook 1. […]
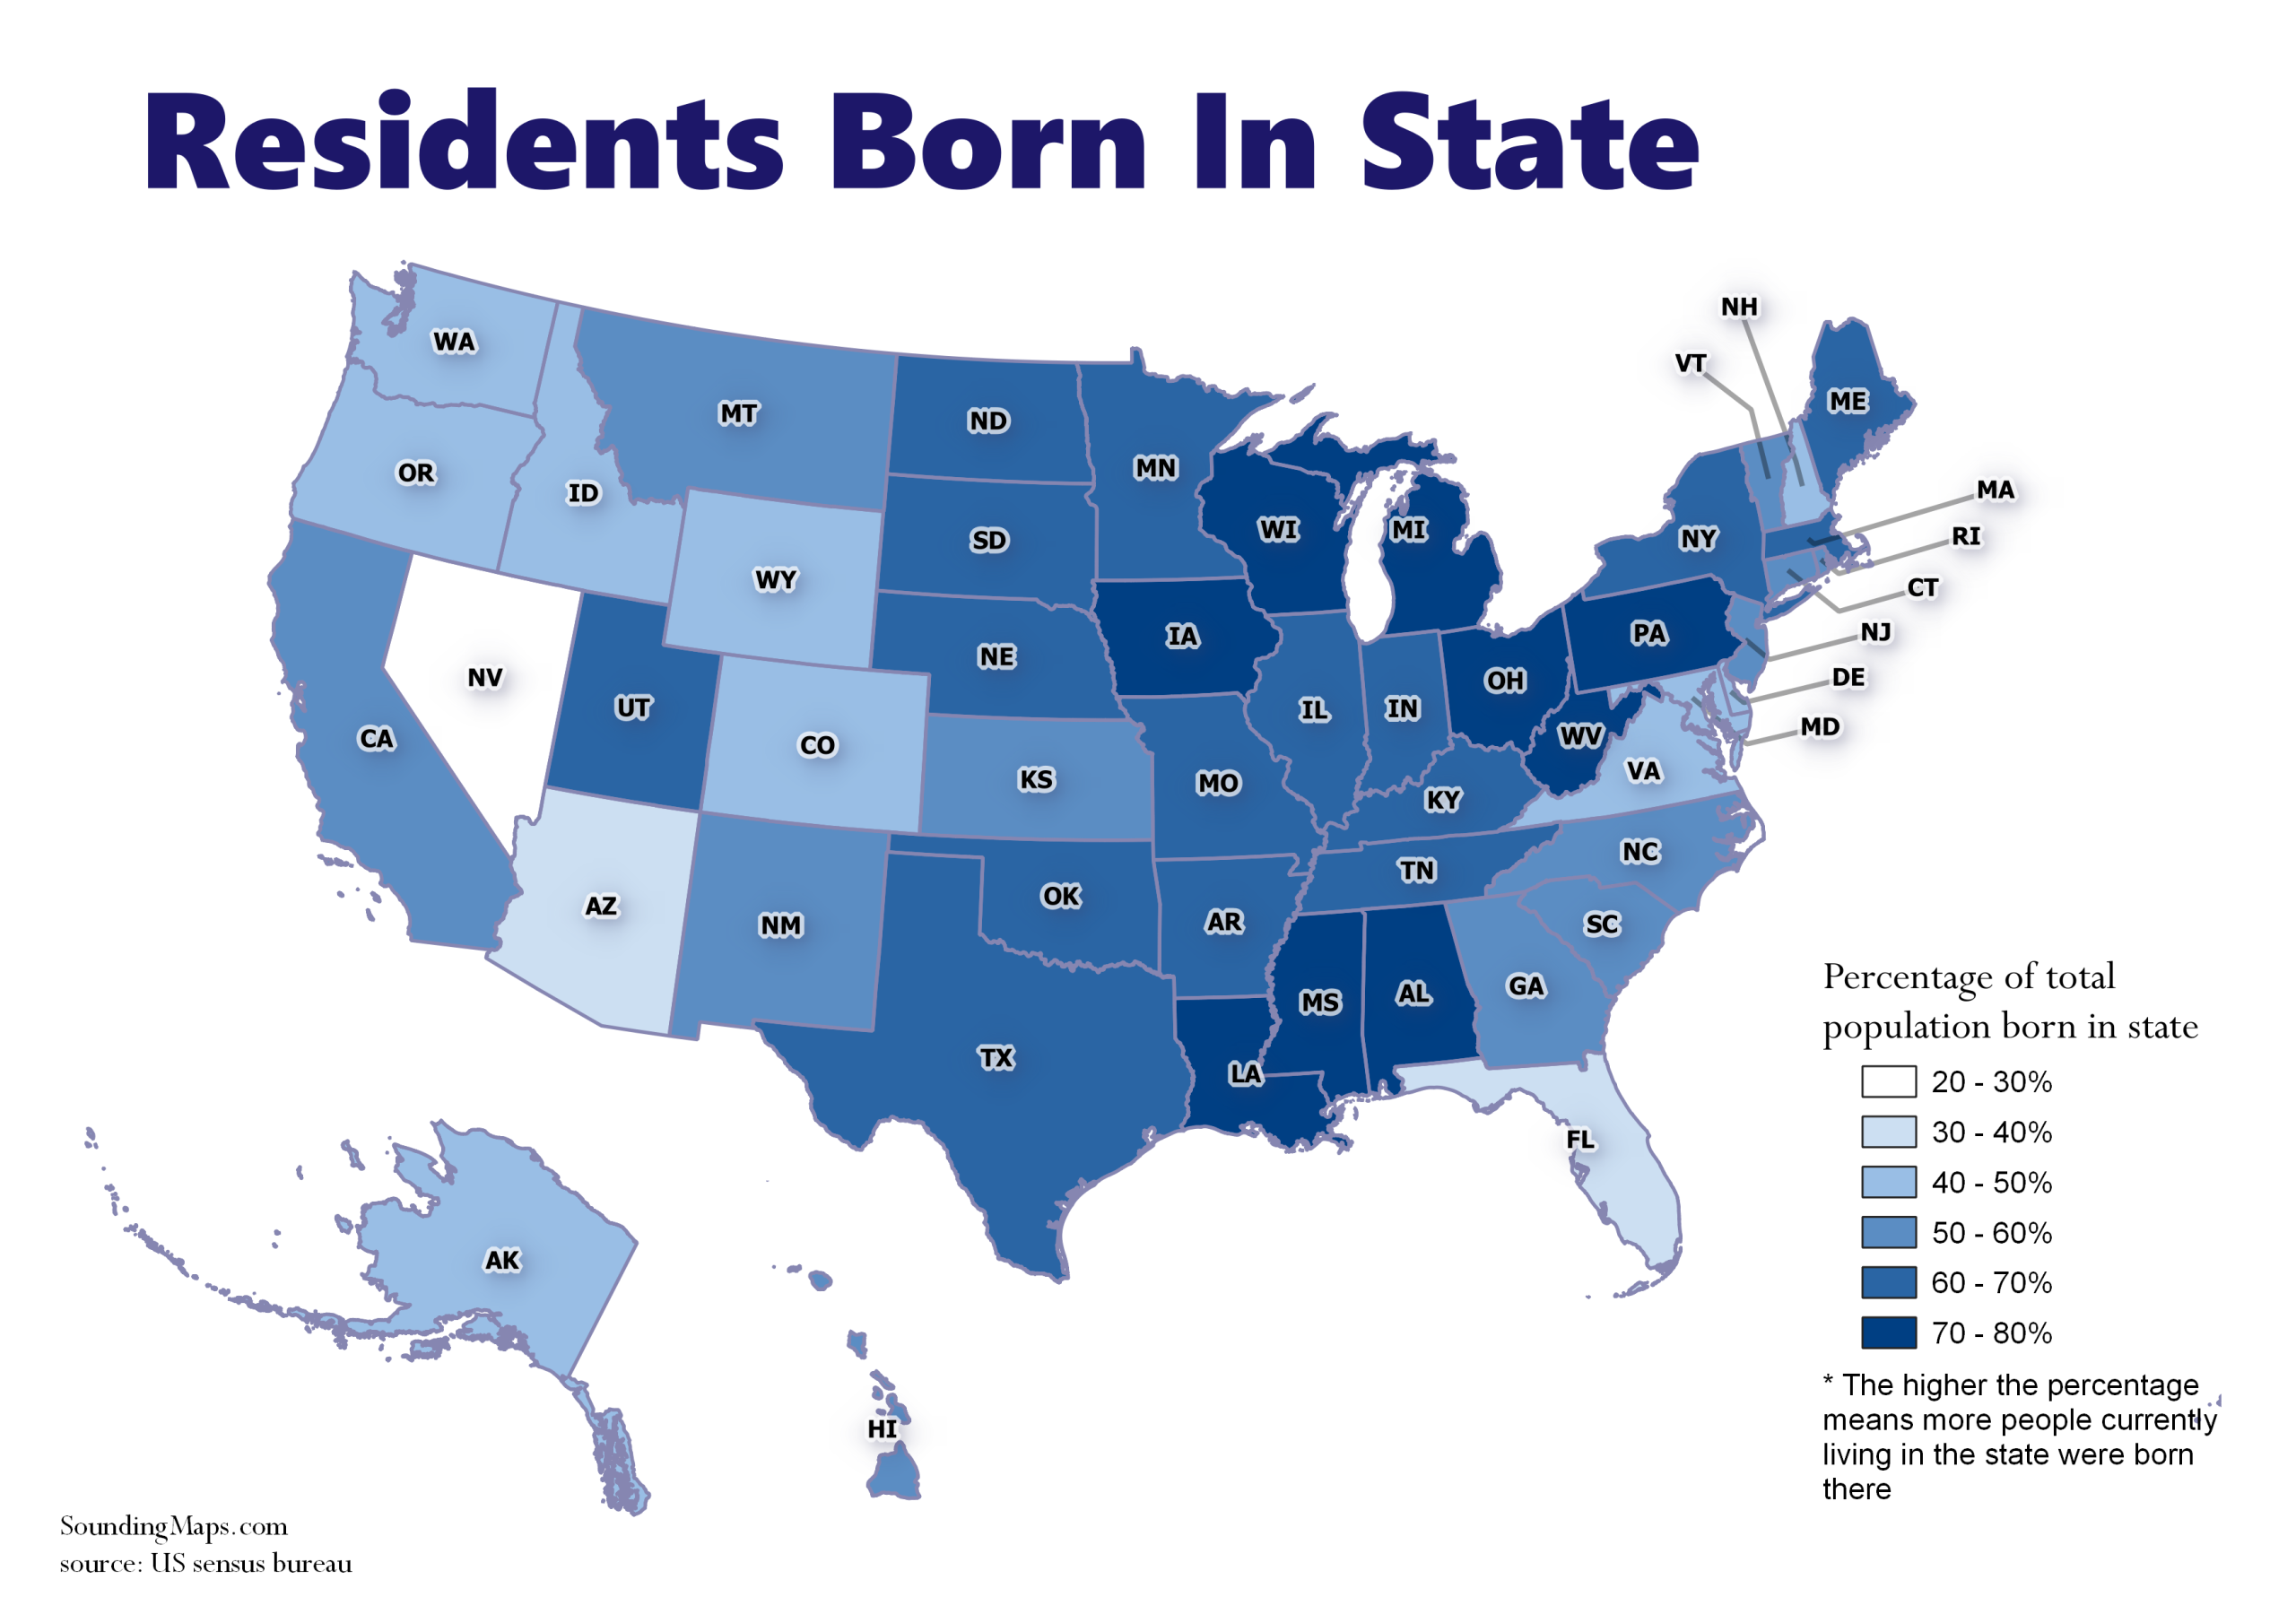
We can visualize the percentage of native residents retained in each state. The darker shaded regions represent states that retain more of their native population. Evidently, not much is keeping people in Nevada. This data shows us where people are moving compared to retaining native population. What this means is […]
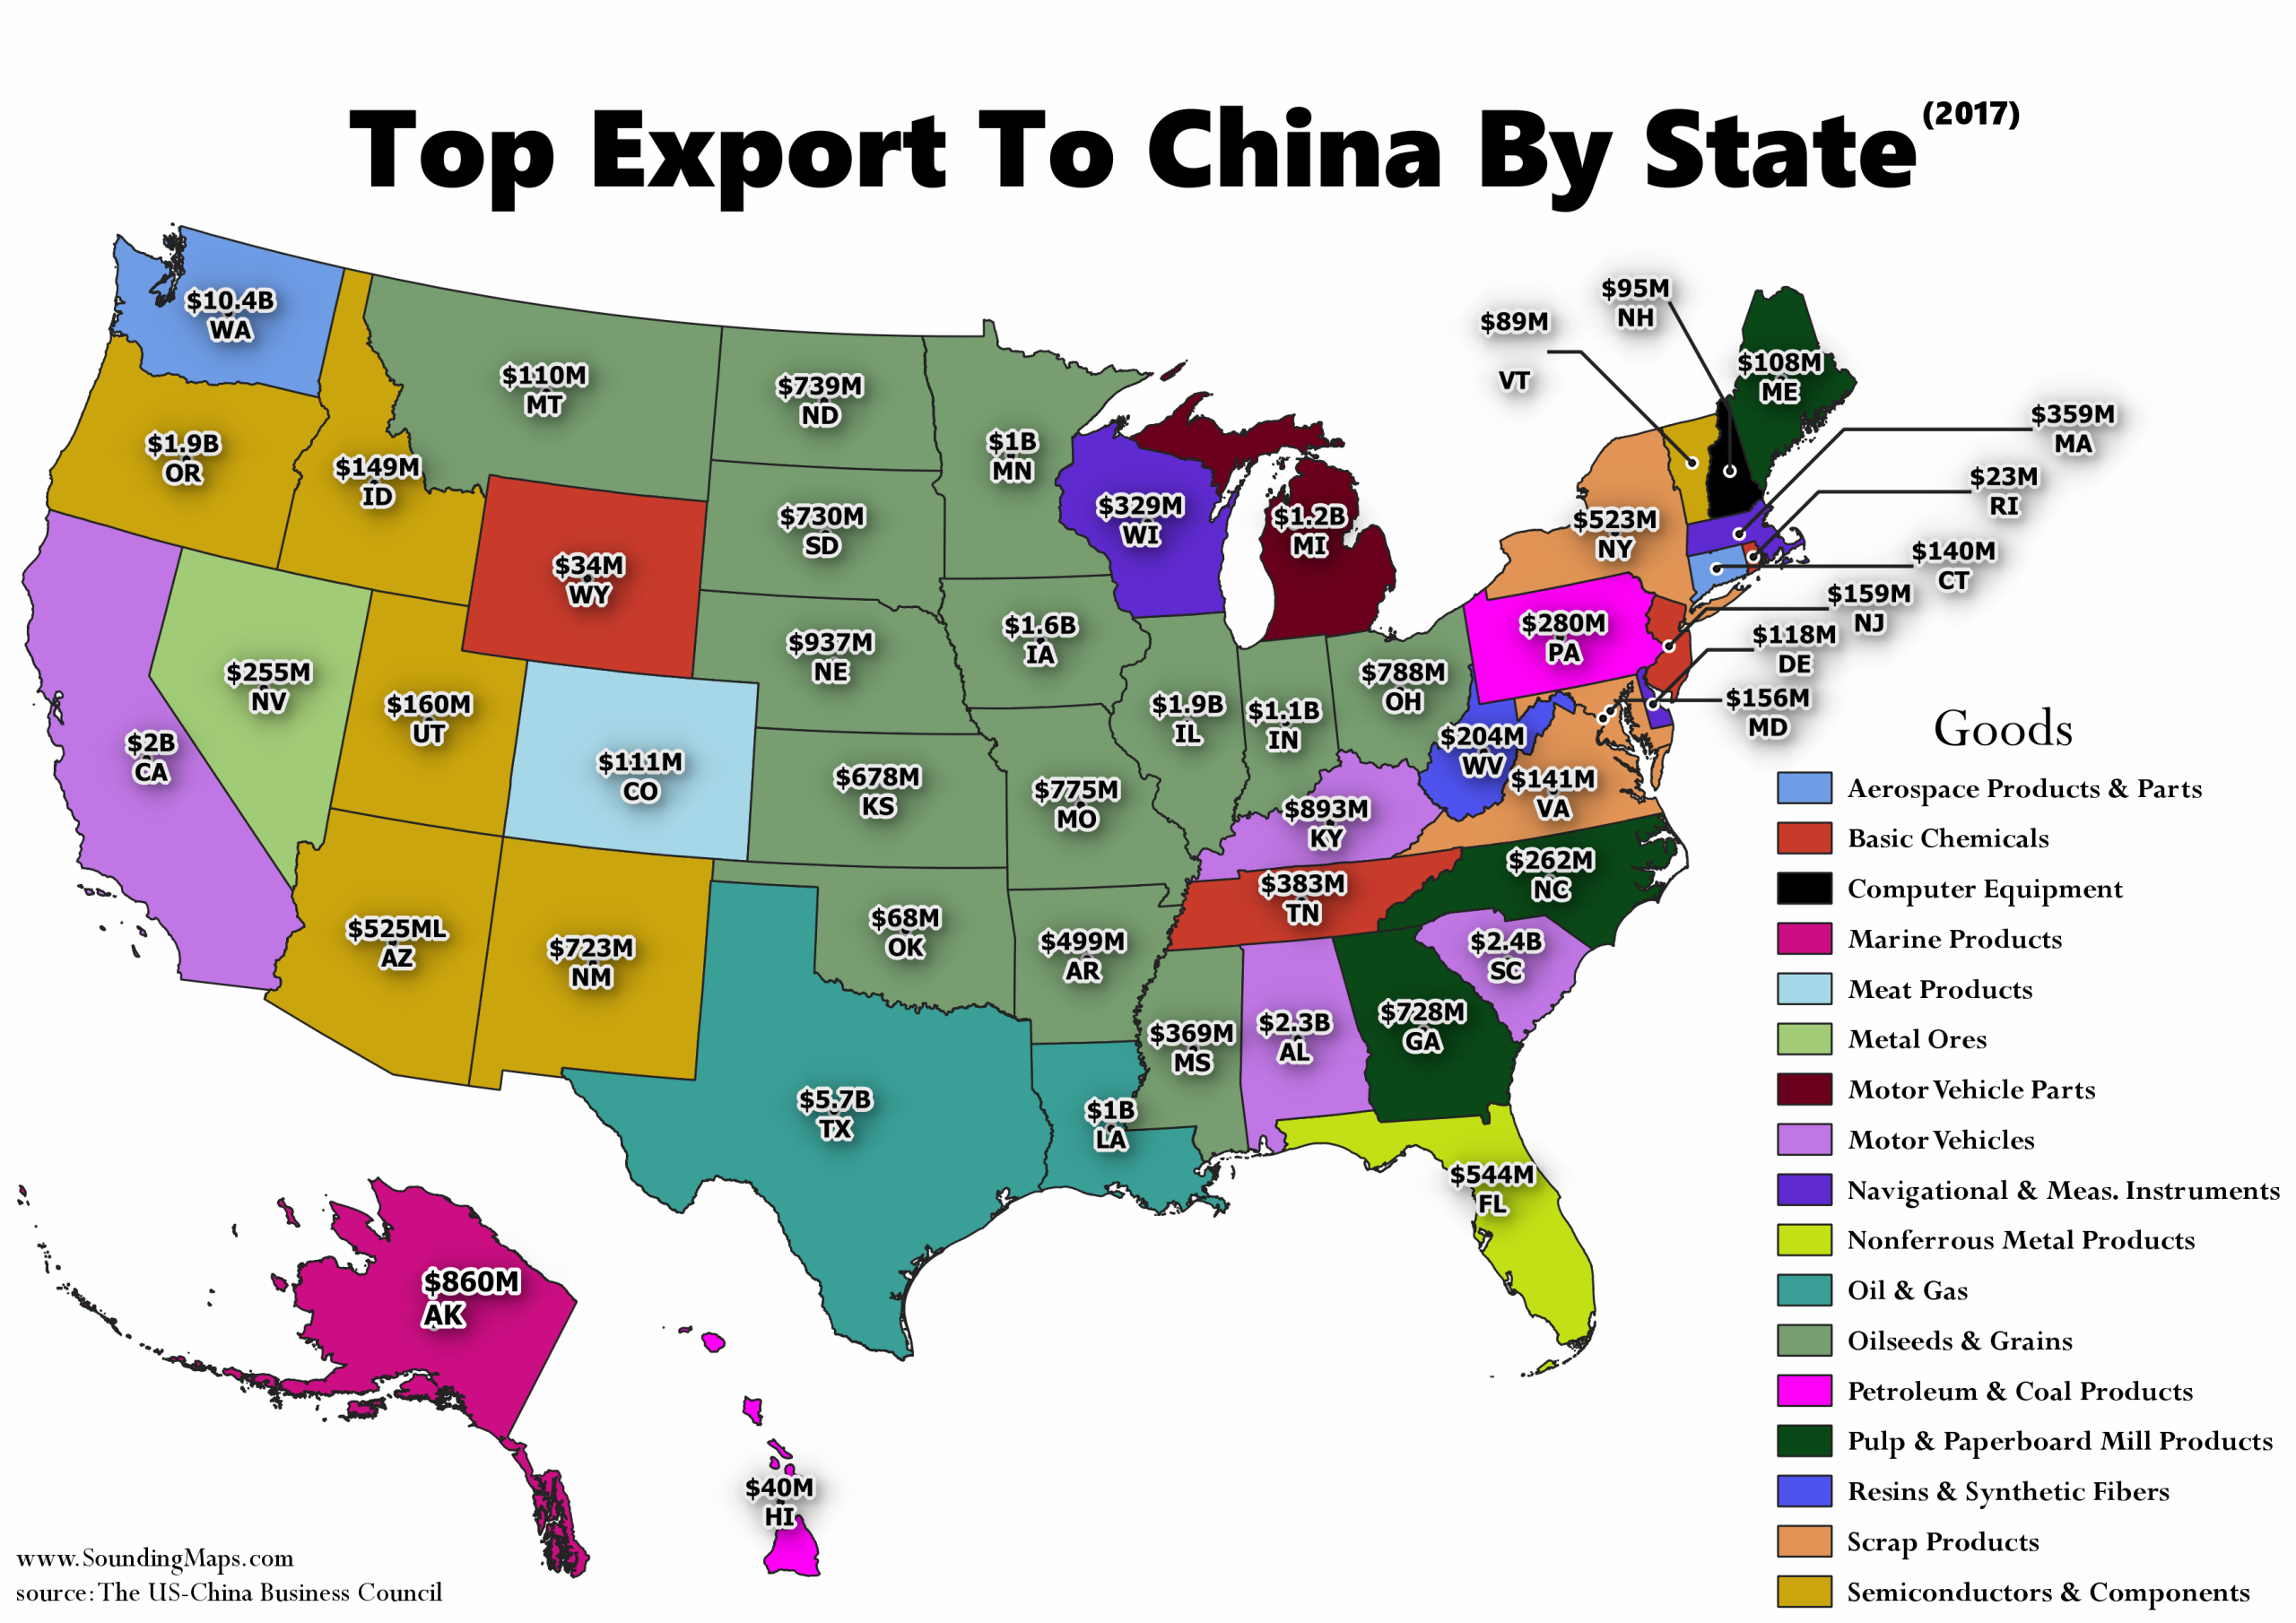
United States goods exports to China continue to outpace export growth to the rest of the world. In 2017, the United States exported more goods to China than ever before—more than $127 billion. The exports to China have grown by 86 percent over the last decade, while exports to the […]